Consumer Price Index March - 3.5%
It’s transitory alright and consumers need to come to terms with the fact that we are transitioning to a new normal - sustained 3%+ inflation.
Many people were surprised with the latest inflation report, however, it’s not all that surprising.
When we understand the main components and drivers of CPI, we can know well ahead of time what to expect.
We can also look to price action in specific asset classes that act as leading indicators.
Focus on commodities, metals and bitcoin.
CLICK: 12-month percentage change, Consumer Price Index, selected categories
The above chart depicts the year over year change in Gasoline - up 1.3% in March.
Notice when gasoline bottomed - June 2023, crude oil was $68 per barrel, now crude is over $85 per barrel - a 30% move higher.
Monitoring the price action in crude oil can give us clues about what to expect regarding gas prices in the future - every trader/investor should monitor crude futures.
Futures - Commodities, Metals & Bitcoin
The Trifecta! Commodities, metals & bitcoin have all been flashing warning signs that 3%+ inflation is the new normal.
Live cattle is up 10% since the start of the new year and up over 100% since the pandemic lows.
Lean hogs are also trading at the high of its range - up 47% in 2024 rallying into the CPI print earlier this week.
Coffee is hitting a brand new 52 week high as we are typing this newsletter, up 53% since October 2023.
Cocoa is trading like a cartoon at this point notching a new 52 week high, up 147% since the start of 2024.
Gold has officially broken out from a decade long cup with handle base trading over $2,300/oz - the target for this cycle is $3,000.
We have been watching this break out since October 2023 when we published:
See below.
Lastly, Bitcoin is consolidating near record highs at $70,000 going into the halving event on April 19, 2024.
For those of you unfamiliar with the halving event, you can read about it HERE when we wrote: An Epic Crash To Be Met With Epic Buying?
Bitcoin was $40,000.
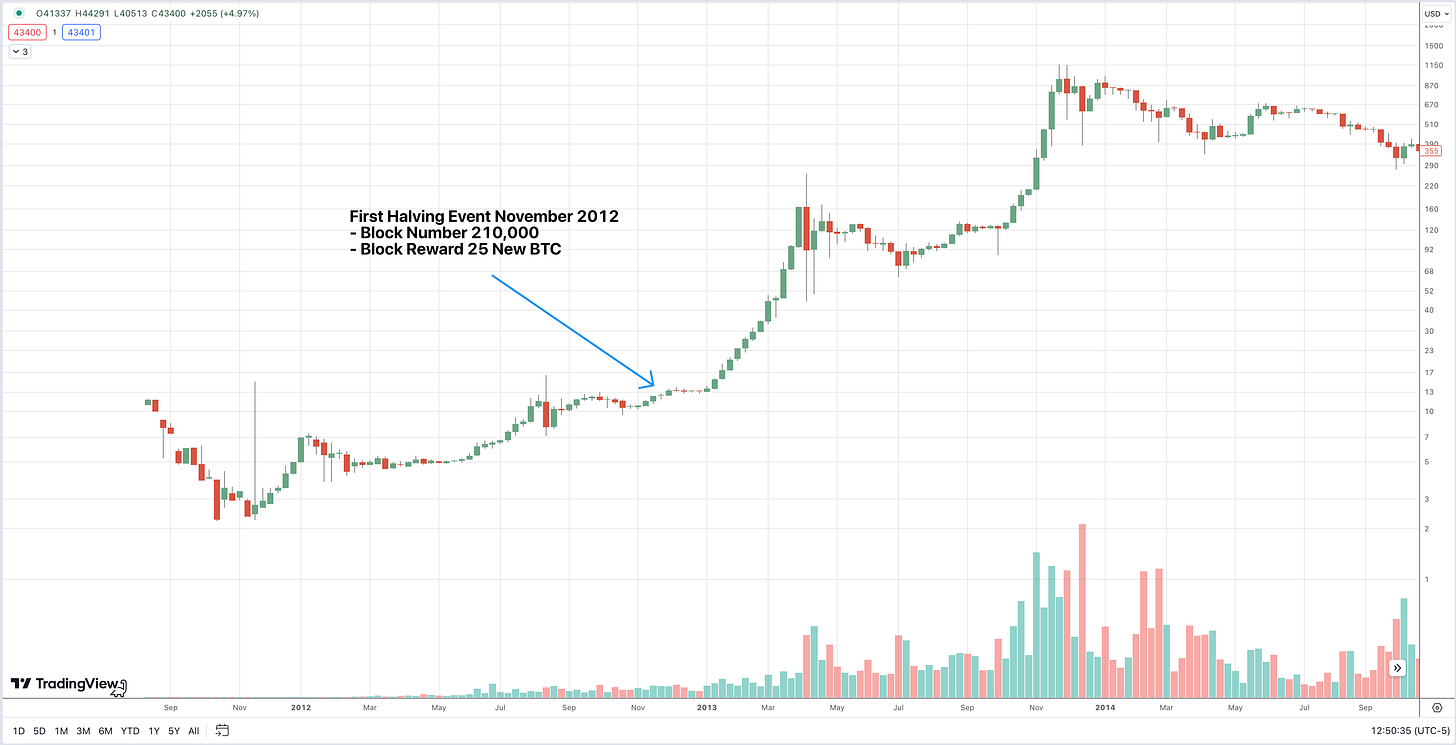
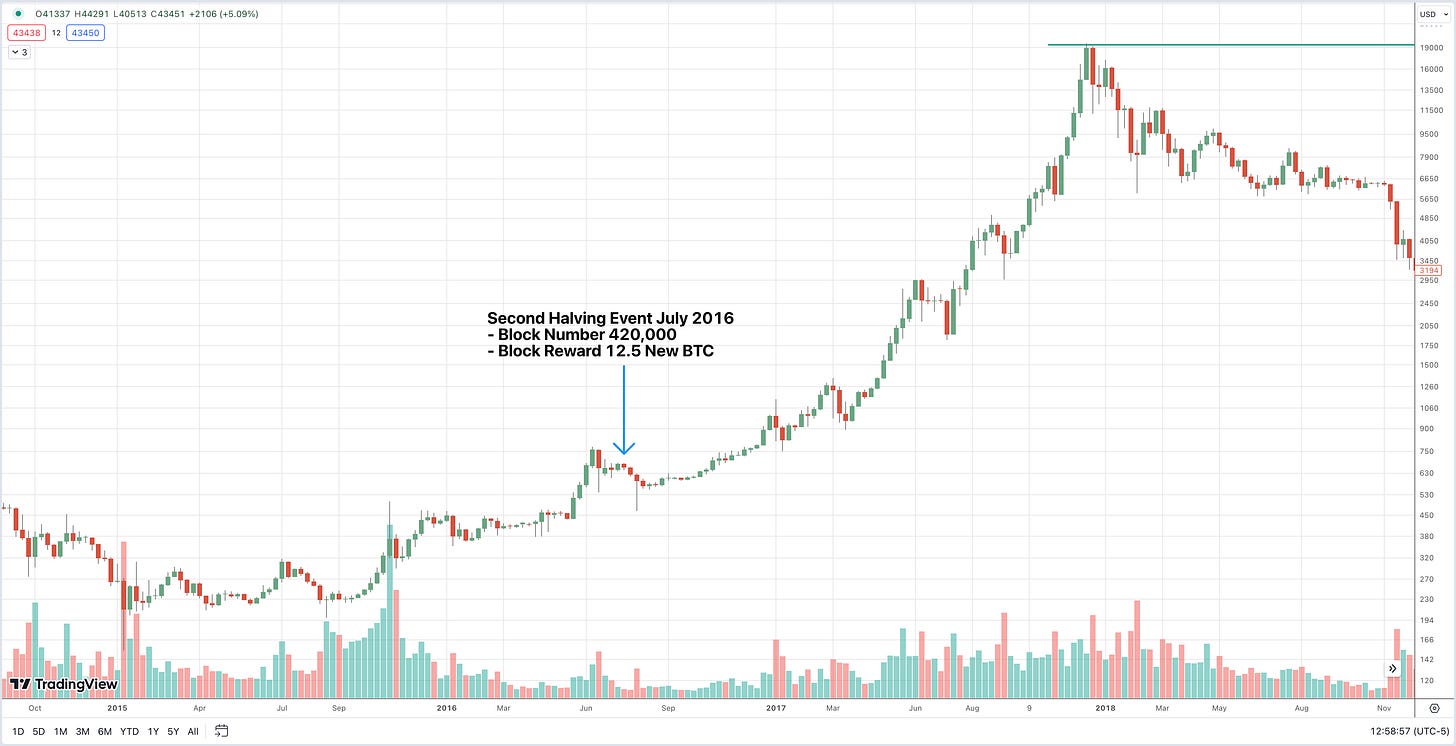
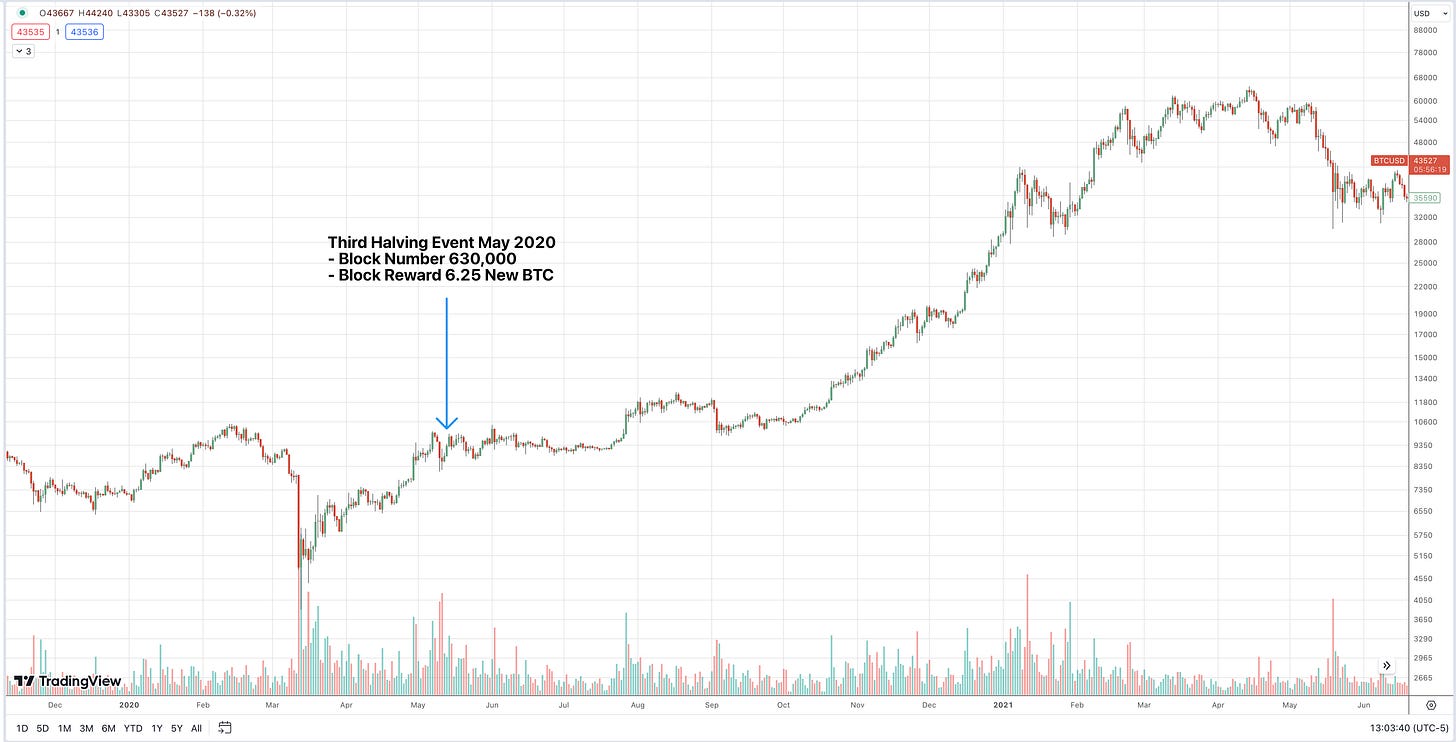
A quick review of historical price action around halving events below:
First Bitcoin Halving - November 2012
The price of Bitcoin went from around $13 to $150 twelve months after the halving.
Second Bitcoin Halving - July 2016
The price of Bitcoin went from around $650 to $2,500 twelve months after the halving.
Third Bitcoin Halving - May 2020
The price of Bitcoin went from around $9,700 to $57,000 twelve months after the halving.
Halving events happen every 4 years or 210,000 blocks on Bitcoin blockchain.
Below is the full history of Bitcoin block rewards:
Metals and bitcoin act as a store of value, safe haven asset and inflation hedge - when you see positive price action in these assets, take it as a sign the market is expecting prolonged inflation.
Raining On Rate Cut Plans
With inflation well above the Feds 2% target - we can say goodbye to a rate cut this summer.
According to the CME Fed Watch Tool there is 95% chance we have no change in the Fed Funds rate in May and a 78% chance we have no change in June.
There is no reason for the Federal Reserve to start cutting interest rates while unemployment sits at 3.8%, equity indices sit near record highs and CPI is still well above the 2% target.
We heard from Federal Reserve President Neel Kashkari last week, he said interest-rate cuts may not be needed this year if progress on inflation stalls, especially if the economy remains robust.
And robust it has been - we just got the March 2024 Manufacturing ISM® Report On Business PMI Numbers at 50.3%.
Manufacturing activity in the United States is roaring back, trending higher for the past year from a low of 46.4% to a March high of 50.3%.
Survey respondents are overwhelmingly positive with many saying performance is defying expectation of a downturn.
Bond Market Action
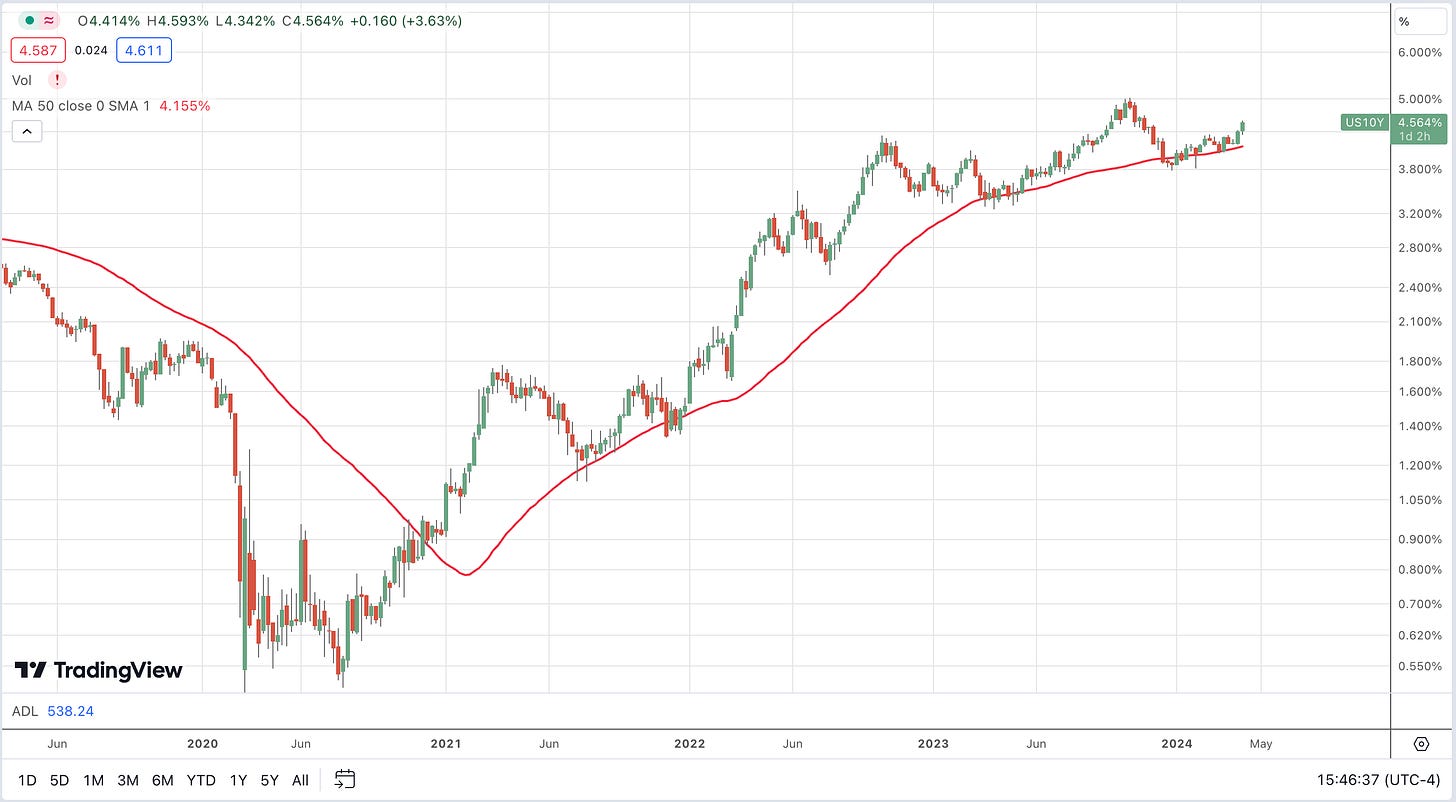
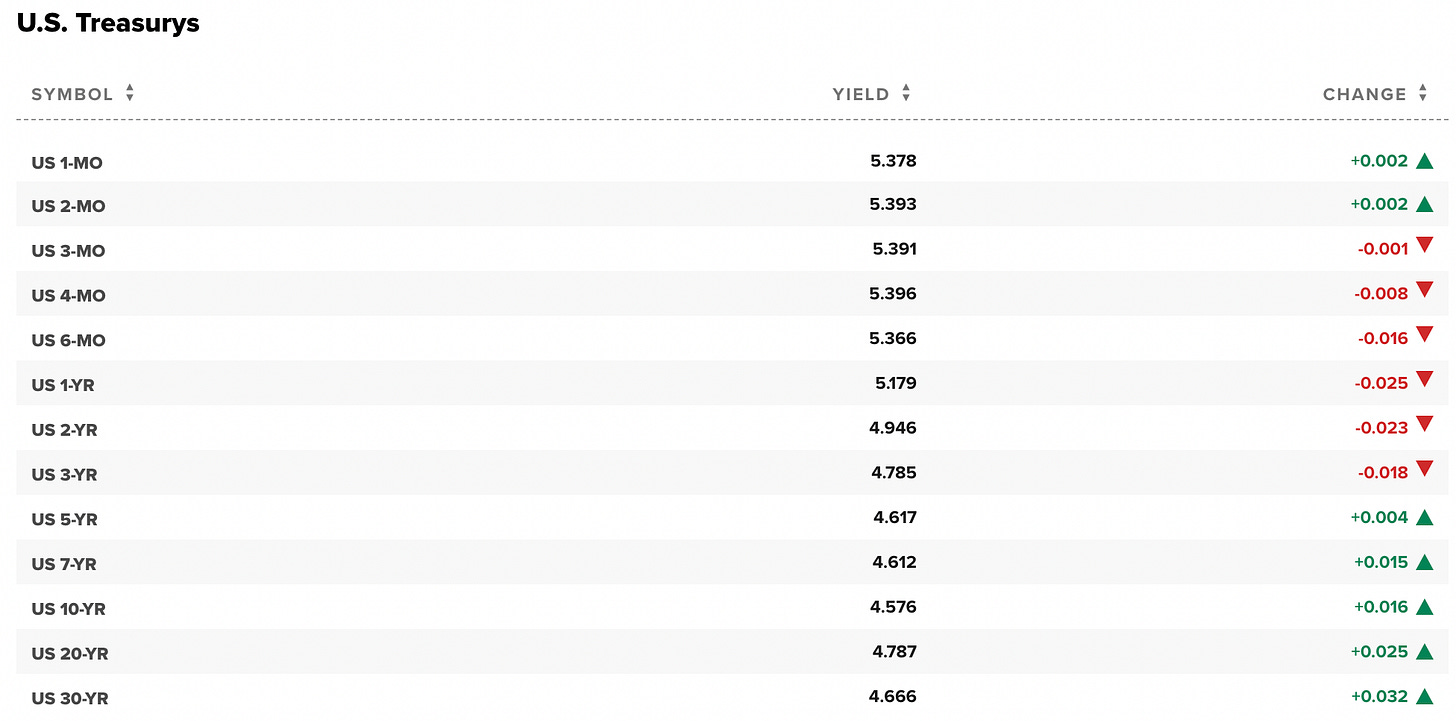
Yields are starting to creep up again after a hotter than expected inflation print - the yield on the 10YR US Treasury rallied to 4.564%.
As bond prices decline yields go up.
The above chart shows the yield on the 10YR US Treasury - rallying from it’s 50 week moving, looking to test the 5% October 2023 high.
This is good news for savers as many money market accounts are now paying 5% risk free.
Thats $50,000 on every $1,000,000 risk free.
Remember, there is now a record $6.3 Trillion sitting in money market accounts.
A look at the Yield Curve:
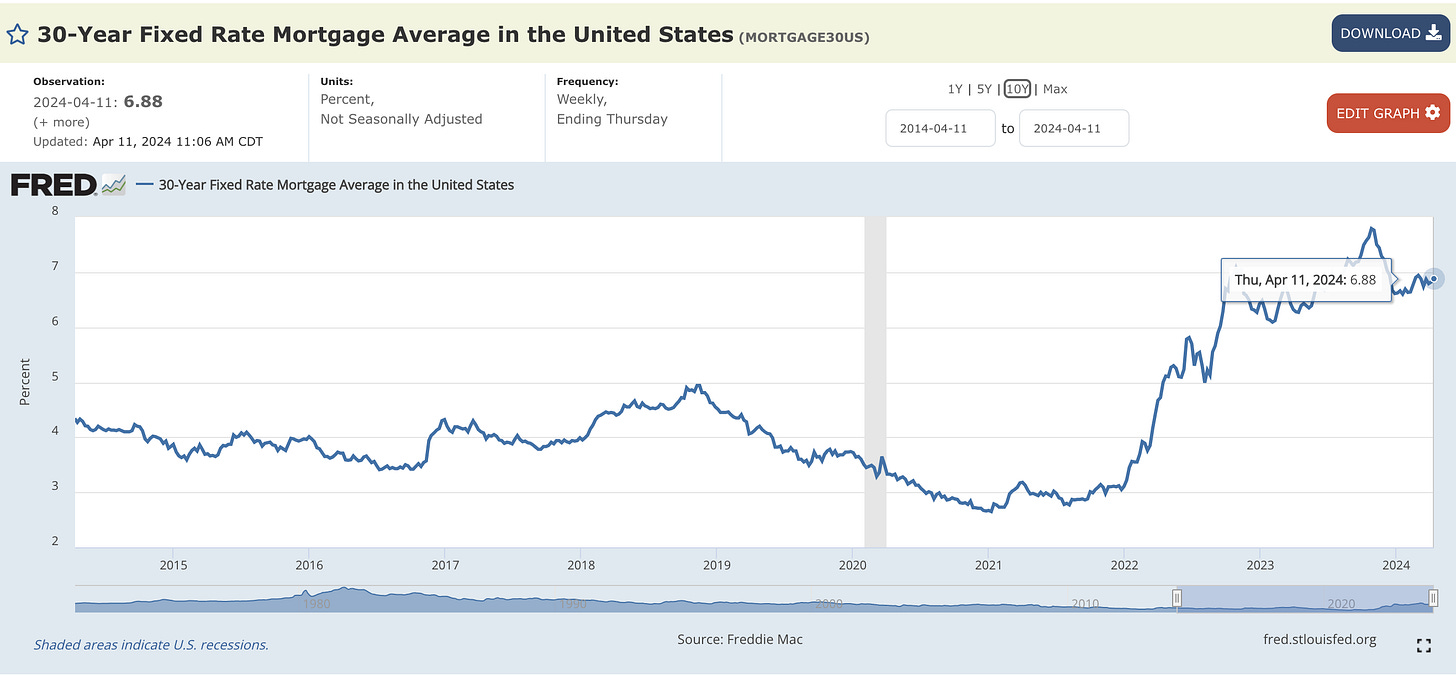
With the recent sell off in bonds you can expect the average 30YR Fixed mortgage rate to increase back to the October 2023 high.
Lean Bullish
It is important to keep perspective and understand the possibility that we are probably very early in a larger bull cycle.
Along the way there will be corrections in both major indices and individual stocks, but the overall trend is higher - use the 50 day and 200 day as your guide.
Above shows new highs vs. new lows on the Nasdaq going back to 2001.
The bear market of 2020 and the most recent bear of 2022 - 2023 was harsher and more extreme than that of the great financial crisis in terms of damage in individual stocks.
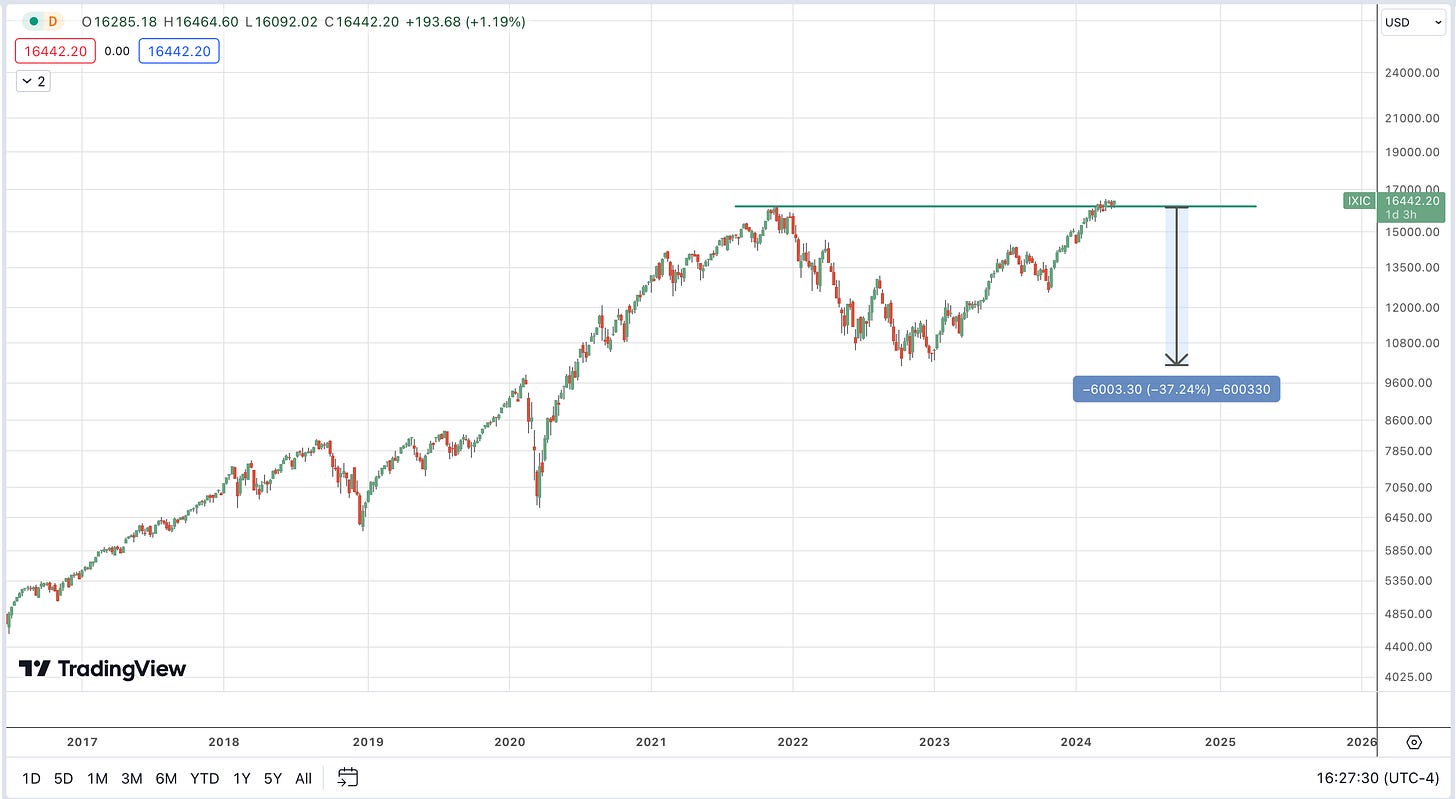
The Nasdaq topped in November 2021 and went on to decline over 6,000 points or 37%.
Understanding beta, if the overall market declined 37% - many individual stocks went on to decline 90% - 99%.
One of the worst bear markets for growth stocks in history.
We are just getting back to the November 2021 highs on Nasdaq.
Who remembers Zoom ZM 0.00%↑ this stock was a covid darling and went on to decline 90% and never recovered.
What about Teladoc TDOC 0.00%↑ another pandemic stock that went on to decline 95% and never recovered.
Peloton? PTON 0.00%↑ is now down 97% and will more than likely continue its decline to $0.
There are many more stocks that were completely wiped out during the last bear market - the damage has been done and its important to remember that this kind of carnage happens at the conclusion of major cycles.
Leading us to believe this is just the start of a new cycle powered by new leaders.
This is why we focus on stocks trading at 52 week and new record highs as a market emerges from a bear to bull as the new leaders are already trading up and out as the junk stays on the bottom forever until they go to $0.
Pay attention as current market leaders correcting to the 50 day as these can be used as areas to add to existing positions as stocks are rebuilding their bases.
We Are Watching Netflix
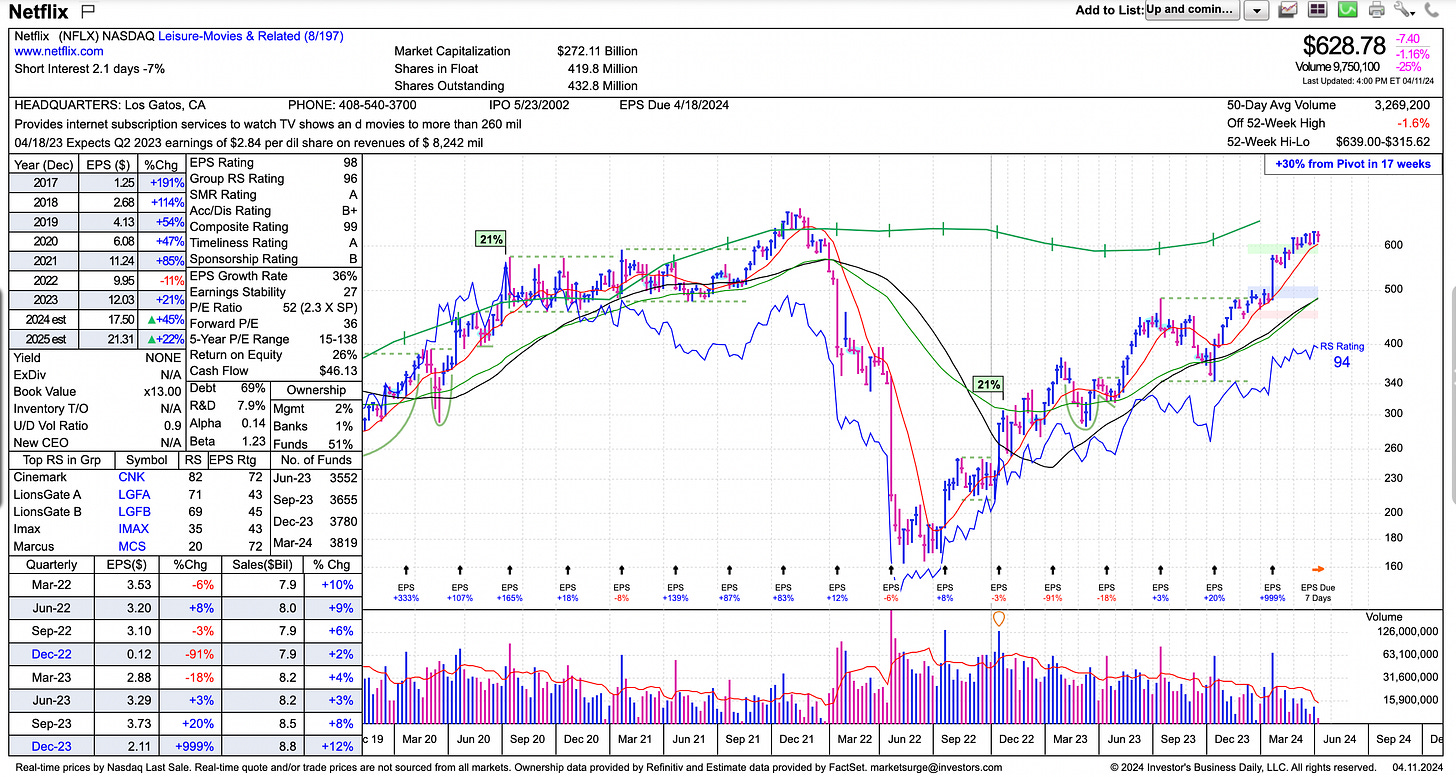
No not like that! our eyes are on the stock NFLX 0.00%↑
After a harsh bear market in this stock, it has managed to work its way through the majority of its overhead supply - testing the previous record high set in November 2021.
By definition this name is a laggard - failing to make a new high while all the other leaders are well into new record highs, but we see opportunity.
Full year 2024 EPS is seen at $17.50 - up 45%.
Full year 2025 EPS is seen at $21.31 - up 22%
After a major earnings decline in 2022, it appears that the company is on track to turning things around - reflected in the earnings and in price action.
A break out into new record highs could warrant a position with a 3% - 5% - 7% stop.
NYC Real Estate Update/Featured Listing
Check out our 3 Bed 3.5 Bath listing at 5 Franklin Place in Tribeca.
List Price: $3,495,000
Features:
Swimming Pool
Gym
Children’s Play Room
Parking in Building
Updates
The Behind The Street Newsletter will be published every other Thursday.
The Behind The Street Newsletter is for educational use only, not financial advice.
The newsletter will have a focus on financial markets, equities, fixed income, real estate and a market update section focusing on New York City & Miami real estate.
I have joined the Kirsten Jordan Team at Douglas Elliman About Me Click Here
If yourself, a family member or friend is looking to buy, sell or rent anywhere in New York or Miami please contact me: Thomas.Malloy@elliman.com
We also work with institutional clients looking for exposure to NYC and Miami.










The Fed has no idea what its doing, just guess work at best.
Very nice article. Congratulations!