Return To Pre-Pandemic Norms, In The Worst Possible Way?
Wall Street Mega Banks Kick Off Earnings Season
Bank Earnings Upbeat - With Sore Spots
JP Morgan Chase JPM 0.00%↑, Bank of America BAC 0.00%↑ and Citigroup C 0.00%↑ were the first major banks to report financial results for the third quarter.
A concerning trend of higher credit delinquencies are accelerating towards Pre-Pandemic levels, inferring that consumers are burning through savings built up throughout 2020 - 2021.
The above slide depicts clear acceleration in NCL: Net Credit Losses, towards the Pre-Covid normalized NCL Rate at Citi of 3.00 - 3.25%.
Branded cards 90 days past due have also been increasing each quarter since Q4 2021, just as unprecedented amounts of fiscal and monetary stimulus started to wane.
Cost of credit at Citi increased by $400 Million in the third quarter to $1.8 Billion.
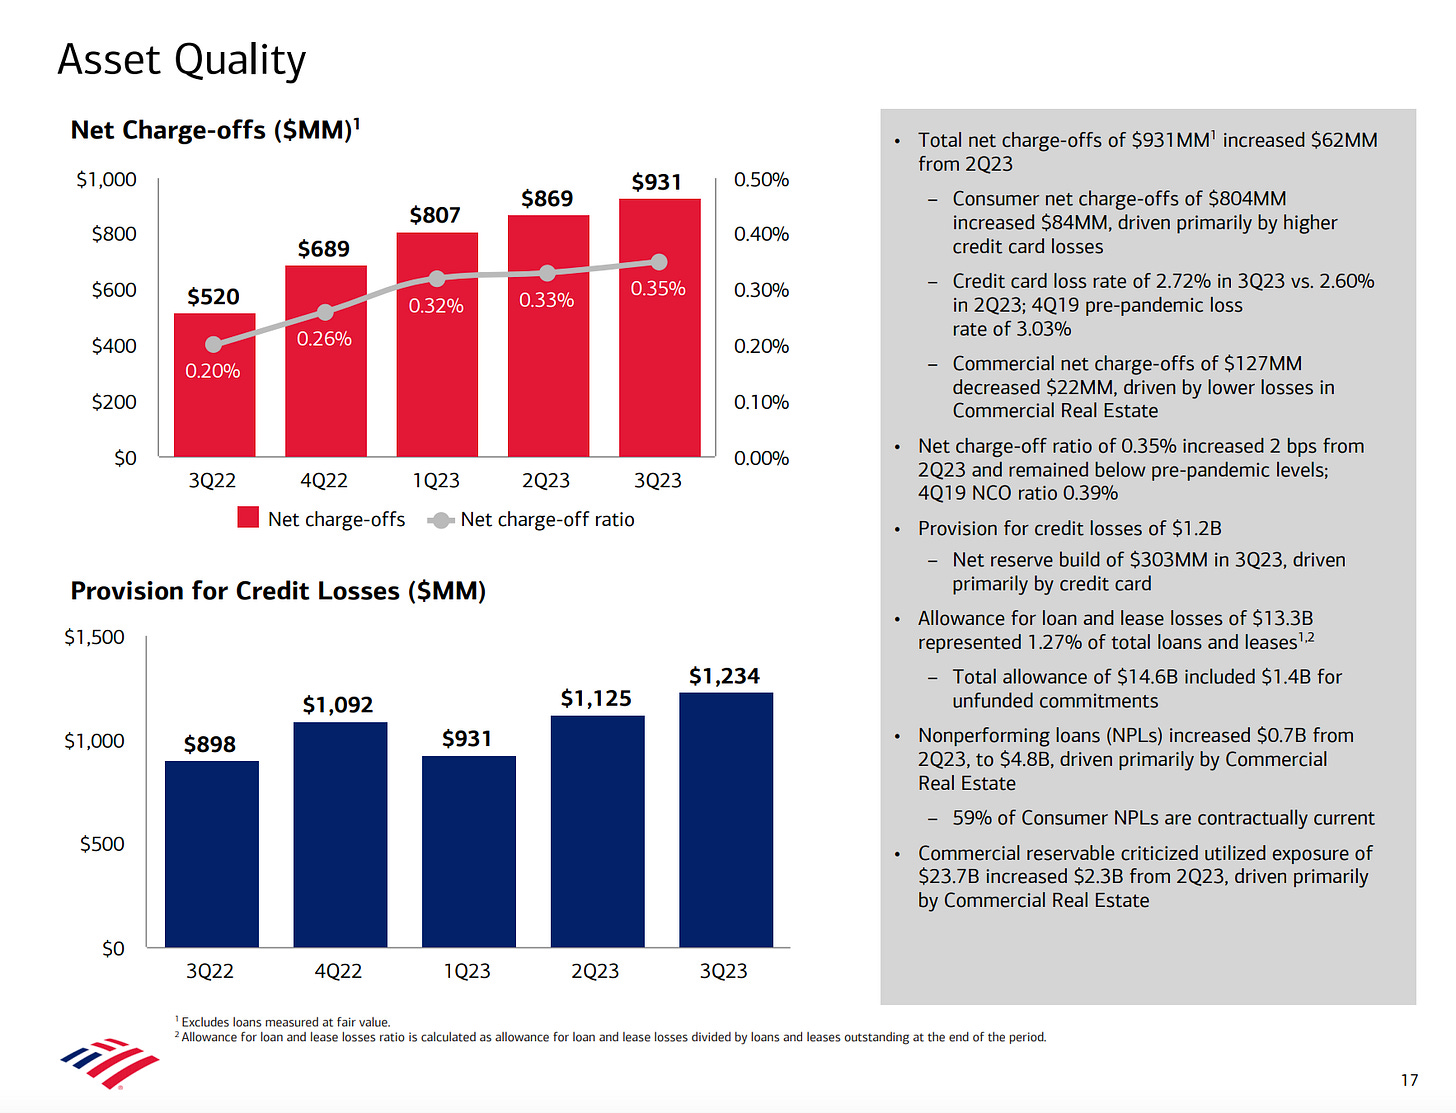
The trend continues at Bank of America.
Net Charge-offs have increased every quarter since Q3 2022 with consumer net charge-offs increasing by $84 Million, driven primarily by higher credit card losses.
Bank of America’s credit card loss rate is steadily climbing its way back to pre-pandemic levels.
Credit Card Loss Rate Trend
Q2 2023 - 2.60%
Q3 2023 - 2.72%
Pre-Pandemic - 3.03%
Aside from Wall Street Mega Banks, pure play credit card companies are experiencing a similar trend.
Discover Financial Services DFS 0.00%↑ has seen a 167 basis point increase in their Net Principal Charge-off Rate in the last 12 months.
The 30 day delinquency rate has ticked up from 1.43% in Q2 2021 to 2.86% in Q3 2023, a 143 basis point increase.
A Critical Trend To Watch - Why?
Given the fact that consumer spending comprises 70% of GDP, it is important to watch closely the trends that dictate consumers ability to spend.
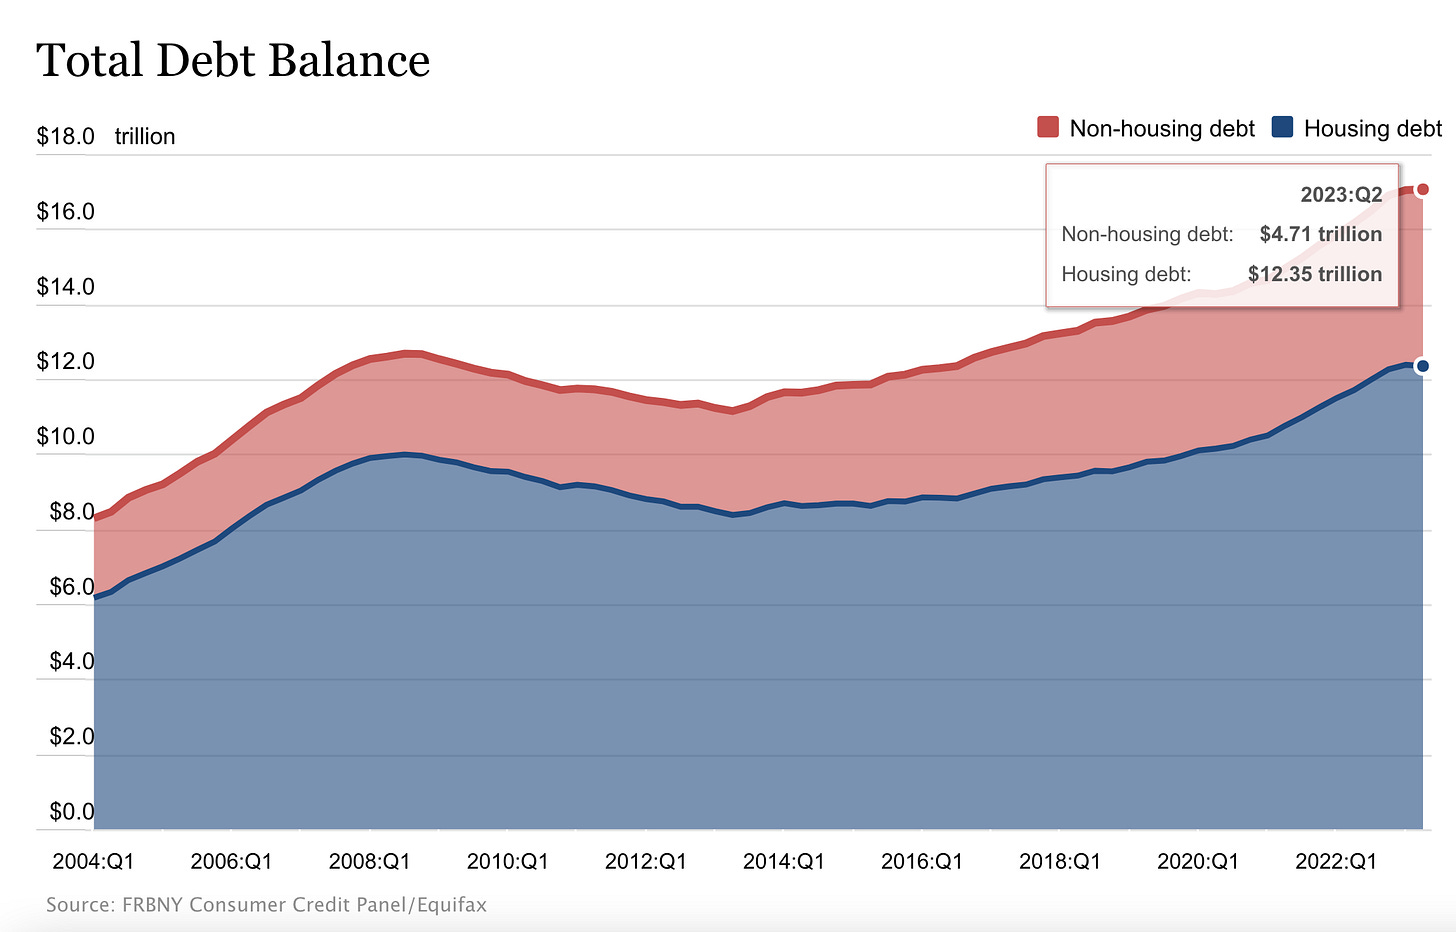
According to the Federal Reserve Bank of New York, total household debt reached $17.06 Trillion in Q2 2023 with credit card balances growing by $45 billion to a high of $1.03 trillion.
The Concern: more consumers are carrying larger balances on credit cards just as the Federal Reserve launches the most aggressive hiking cycle since Paul Volcker.
(Paul Volcker served as the 12th chairman of the Federal Reserve from 1979 to 1987)
When the Federal Reserve raises interest rates, your credit card's APR usually also increases.
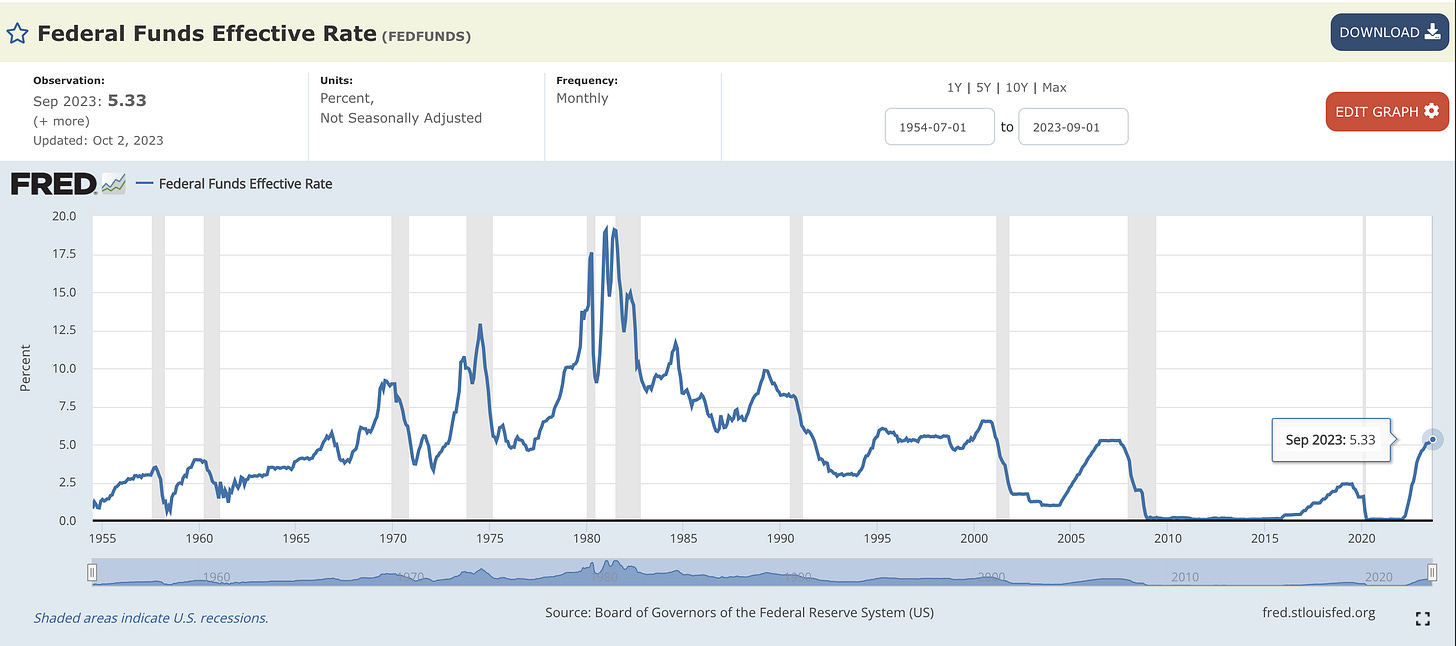
Consumer credit balances sit at record highs just as interest rates reach their highest levels in over a decade.
The Fed Funds target rate is 5.25% - 5.50% with the next monetary policy decision being made at the conclusion of the Federal Open Market Committee (FOMC) meeting on November 1, 2023.
Conclusion:
The probability of a slowdown in consumer spending in Q1 2024 is high based on growing debt balances, increased delinquency and higher interest rates.
With consumer spending comprising 70% of GDP, expect an earnings decline in select sectors, particularly small cap stocks.
Higher Rates Impact Small Caps
“Interest rates act on financial valuations the way gravity acts on matter” - Berkshire Hathaway Chairman Warren Buffett
The iShares Russell 2000 ETF is down 5.58% year to date in comparison to a positive 9.63% for the Vanguard 500 Index Fund ETF (S&P 500)
The above chart depicts steep price declines for the small cap index, breaking below the 200 day moving average on heavy volume.
Generally speaking, balance sheets of small cap companies are much weaker than larger cap companies as interest payments take up a large chunk of their earnings.
30% of Russell 2000 companies’ debt is floating rate vs just 6% for the S&P 500.
As the Federal Reserve further tightens monetary conditions, the ability for small caps to service their debts become increasingly challenging.
S&P 500 debt maturing in manageable chunks, but not the Russel 2000.
There is a wall of long-term debt maturing for Russel 2000 companies over the next 4 years, and assuming these companies will need more capital to operate, they’ll have to pay significantly higher interest rates.
This will result in an earnings decline and in some cases, bankruptcy.
The more dependent a company is on borrowing money to stay in operation, the higher probability of a severe earnings recession or bankruptcy when compared to companies flush with cash.
Higher Rates - Higher Bankruptcy Filings
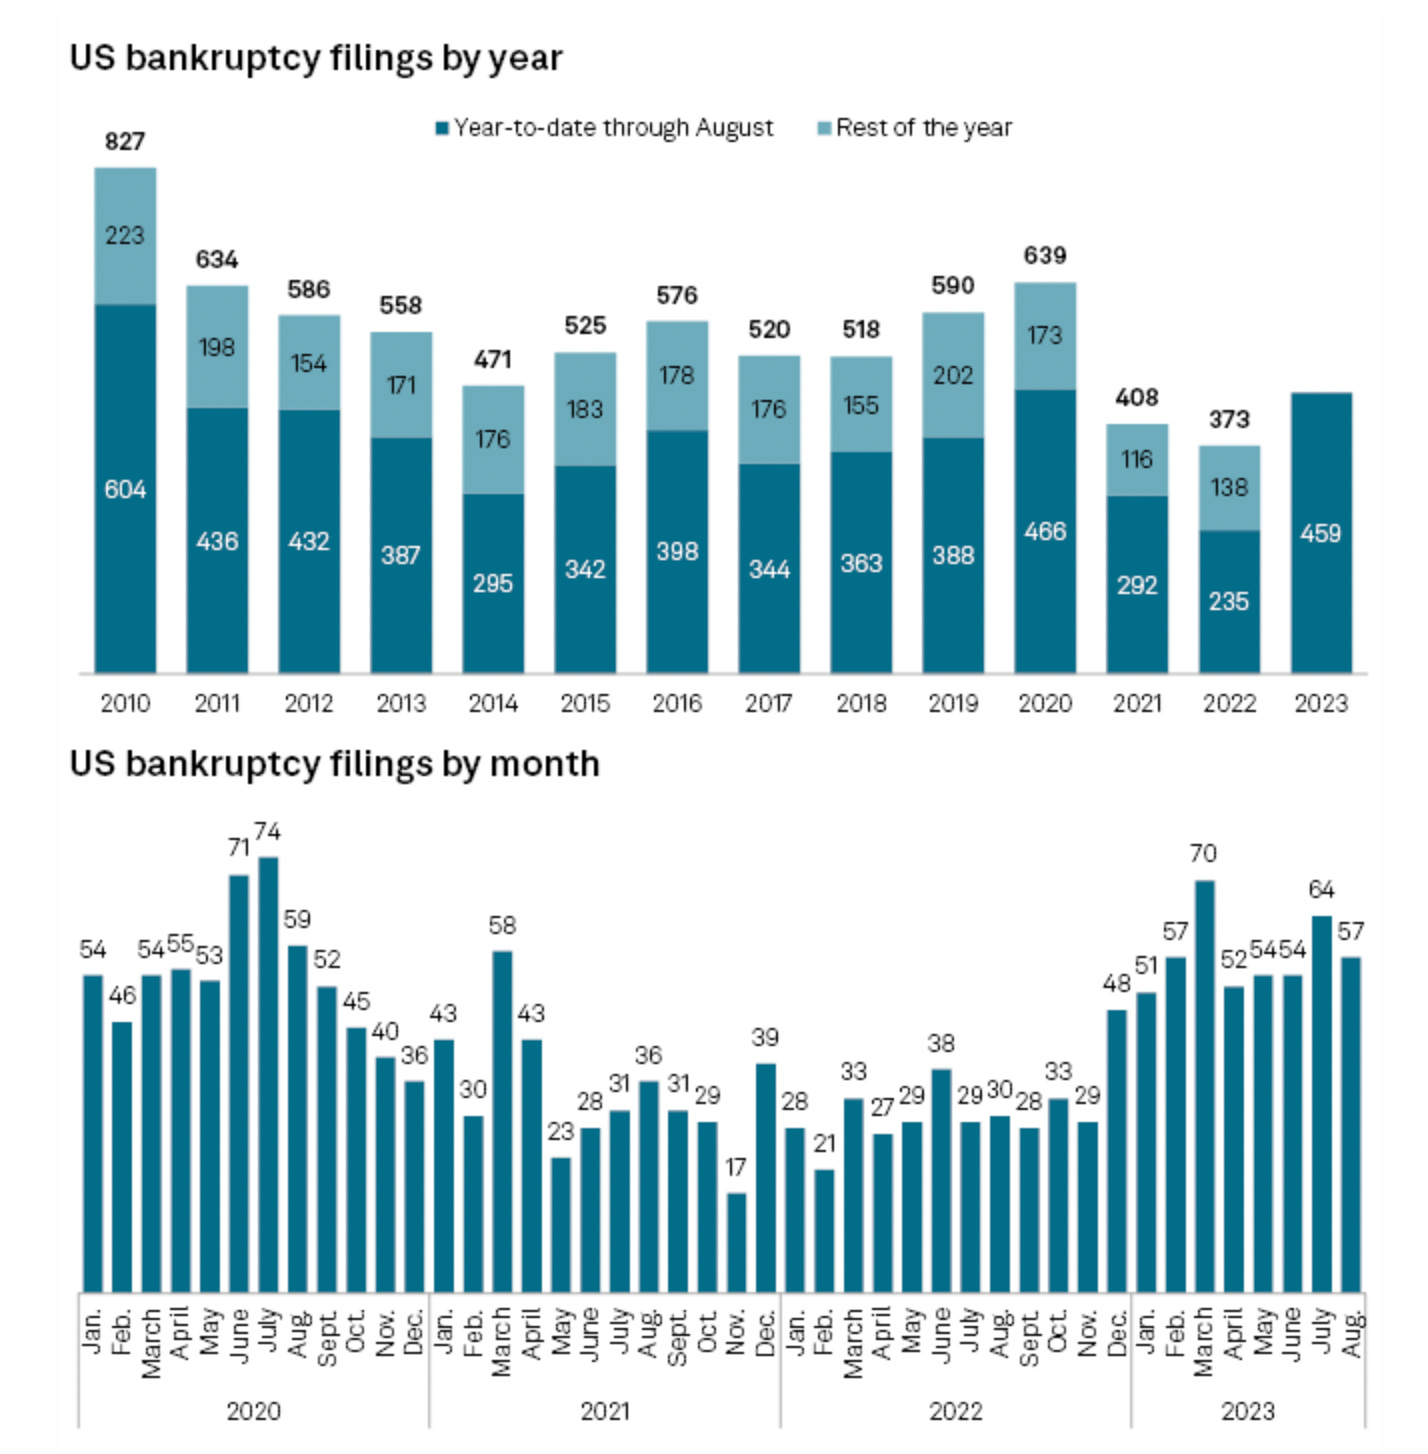
According to S&P Global Market Intelligence, US corporate bankruptcies filed year-to-date have exceeded annual totals for both 2021 and 2022.
There were 459 bankruptcy filings in 2023 as of Aug. 31 and 77 filings in August alone.
The above chart depicts bankruptcy filings broken down by year and by month.
Notice the correlation in filings since the start of quantitative tightening.
Goldman Sachs Cuts CRE Exposure
The news of very aggressive marks on Goldman’s CRE office exposure reminds me of a famous quote from a notable scene in the 2011 movie Margin Call.
“Be first, be smarter, or cheat. and I don't cheat.”
Goldman Sachs GS 0.00%↑ reported earnings October 17th beating revenue estimates, missing on EPS.
The stand out from the call was the major reduction in Goldman’s exposure to CRE office by about 50%.
It seems Goldman Sachs wants little to no exposure to commercial real estate - office.
Please see excerpt below from Goldman Sachs Q3 2023 Earnings call addressing CRE office exposures.
The probability of steeper price declines in commercial real estate in comparison to residential are high.
$1.5 trillion worth of commercial real estate loans will mature over the next 3 years.
With vacancy increasing across the country, commercial operators will be in a position of declining rent rolls and increasing costs.
Goldman Sachs seems to be getting ahead of it.
Magnificent 7 Earnings
The Magnificent 7 includes the following:
Apple AAPL 0.00%↑
Amazon AMZN 0.00%↑
Microsoft MSFT 0.00%↑
Meta META 0.00%↑
Alphabet GOOGL 0.00%↑
Tesla TSLA 0.00%↑
Nvidia NVDA 0.00%↑
Expect the majority of earnings strength to be generated from the top 7 tech powerhouses. Collectively they account for 30% of S&P 500 market cap.
Results:
October 18 - Tesla reported a Q3 2023 net profit of $1.85 billion down from $3.29 billion in Q3 2022.
October 24 - Alphabet reported a Q3 2023 net profit of $19.6 billion up from $13.9 billion in Q3 2022.
October 24 - Microsoft reported a Q1 2024 net profit of $22.3 billion up from $17.56 billion in Q1 2023
October 25 - Meta reported a Q3 2023 net profit of $11.6 billion, up from $4.4 billion in Q3 2022
October 26 - Amazon reported a Q3 2023 net profit of $9.9 billion, up from $2.9 billion in Q3 2022
Apple is set to report on November 2, 2023
Nvidia is set to report on November 21,2023
Weak Market Breadth
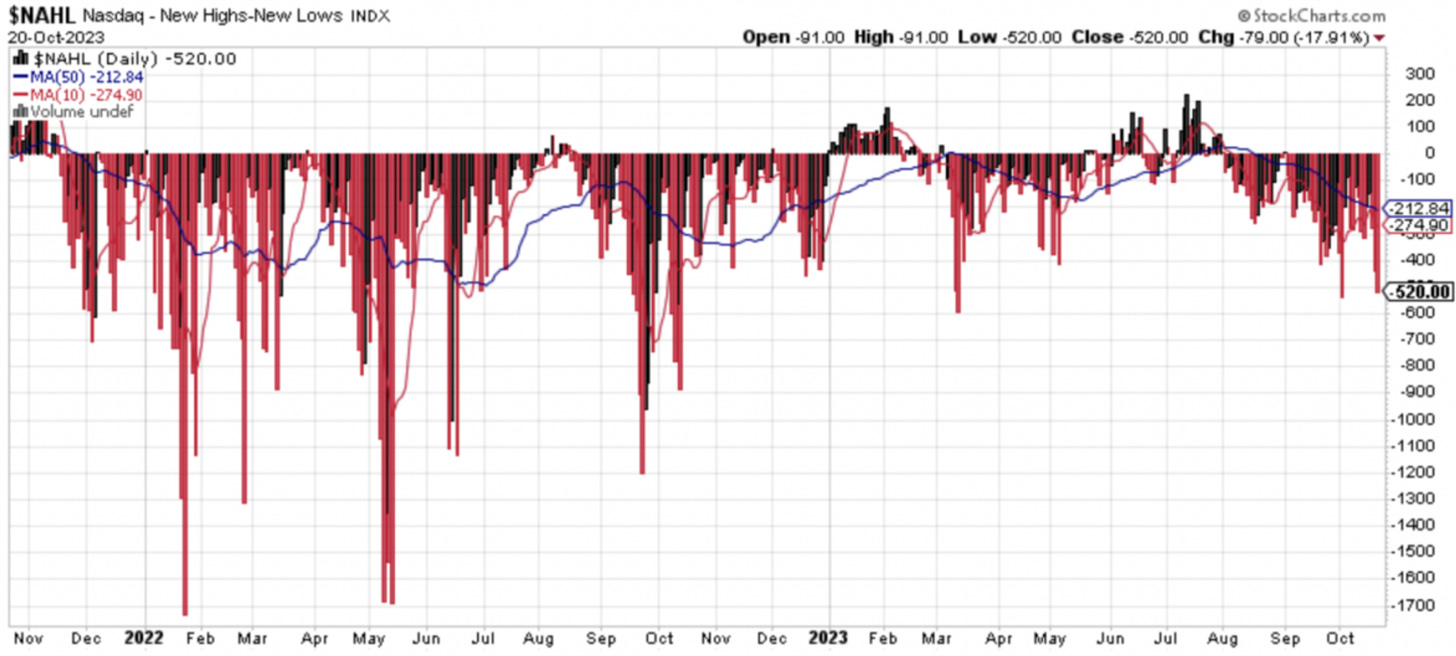
The overall breadth of the market has deteriorated significantly with stocks making new lows outnumbering new highs.
October 27, 2023
Only 566 stocks advanced with 9 making new highs, compared to 1,827 declining and 388 making new lows.
Out of all the companies in the S&P 500, only 27% are trading above their 200 day moving average.
During the Covid-19 crash the percentage of stocks trading above their 200 day moving average plummeted to 3%.
We are likely to see further deterioration in breadth with a relief rally coming as the the index approaches 10%.
Market conditions are extremely oversold, sentiment is negative. A rally in stocks is likely as the major indexes are extended from the 50 day moving average.
Here is another visual, this time of new highs - new lows on the Nasdaq.
The Flight To Safety
As turmoil sweeps the globe there is a mad dash into precious metals, particularly GLD 0.00%↑ Gold.
Pictured above is a monthly chart of gold dating back to 1977.
Gold topped in September 2011 and has been in a corrective phase ever since, carving out one of the largest and perfectly shaped cup the handle patterns.
Gold has been building the right side of the handle in a price range between $1,625 - $2,000/oz.
A break out into new highs on significant volume would justify a position in substantial size as the measured move is around $3,000/oz.
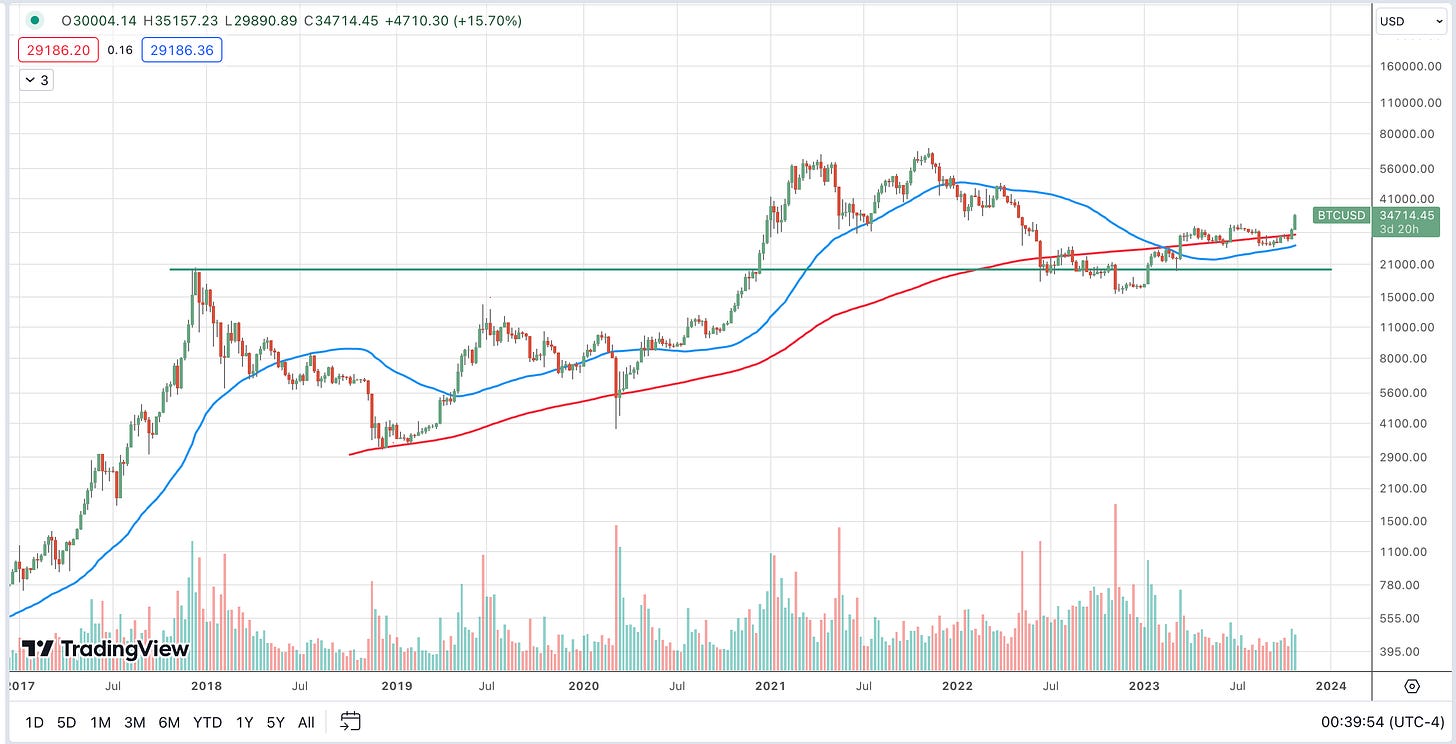
Digital gold, Bitcoin is acting extremely well building out the right side of its base and breaking above $34,000.
Bitcoin in the only unconfiscatable asset in the world and with geopolitical risk rising, money is moving into bitcoin.
Other catalysts include extreme economic instability in China leading wealthy individuals to move money out of the country. I suspect a portion of that is going into bitcoin.
NYC Real Estate Update/Featured Listing
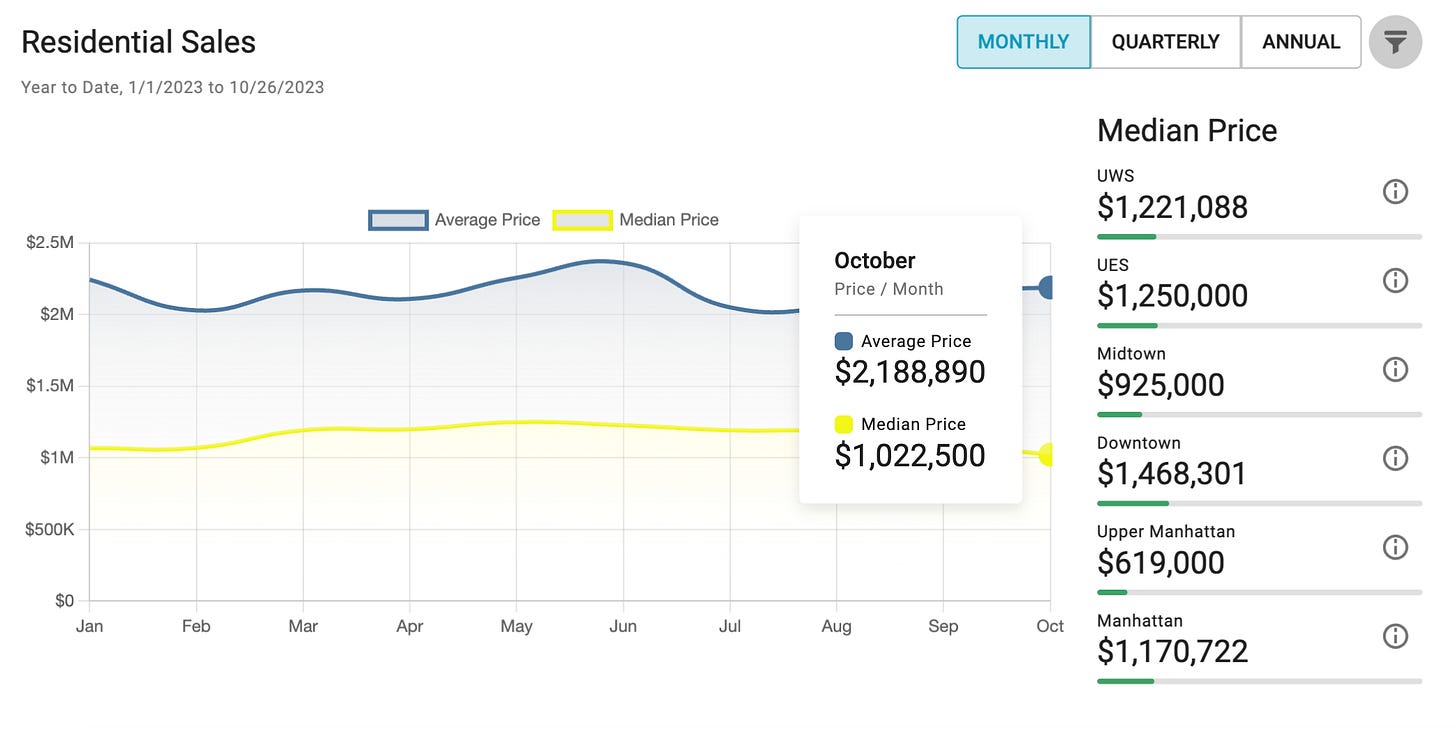
Listing inventory in Manhattan stands at 8,365 with a median list price of $1,697,206 and median price per square foot of $1,106.
The average 30 Year Fixed Mortgage rate hit a high of 8% late last week as the US10YR yield briefly broke above 5%.
New to market and priced to sell is our newest listing at 5 Franklin Place in the heart of Tribeca, a rare 3 bed 3.5 bath gem for listed at $3,495,000.
Amenities include a full-time concierge and doorman, swimming pool, children’s playroom, gym and private parking space available for purchase.
Please email myself or Kirsten Jordan for a showing.
CLICK HERE TO VIEW THE LISTING!
If yourself, a family member or friend is interested in 5 Franklin Place, email me: Thomas.Malloy@elliman.com
Updates
The Behind The Street Newsletter will be published every other Thursday.
The Behind The Street Newsletter is for educational use only, not financial advice.
The newsletter will have a focus on financial markets, equities, fixed income, real estate and a market update section focusing on New York City & Miami real estate.
I have joined the Kirsten Jordan Team at Douglas Elliman About Me Click Here
If yourself, a family member or friend is looking to buy, sell or rent anywhere in New York or Miami please contact me: Thomas.Malloy@elliman.com
We also work with institutional clients looking for exposure to NYC and Miami.











A beautiful overview analysis of the market. All the best! Peace out
Really good stuff. Thanks for sharing your insights.