When Everything Breaks Down.. RS Is All That Matters
A Bifurcated Market

Distribution Days Are Adding Up: Time to Worry About Nasdaq?
Although the Nasdaq 100 is less than 4% below its record high, it still feels like we’re in a stock market correction, why is that?
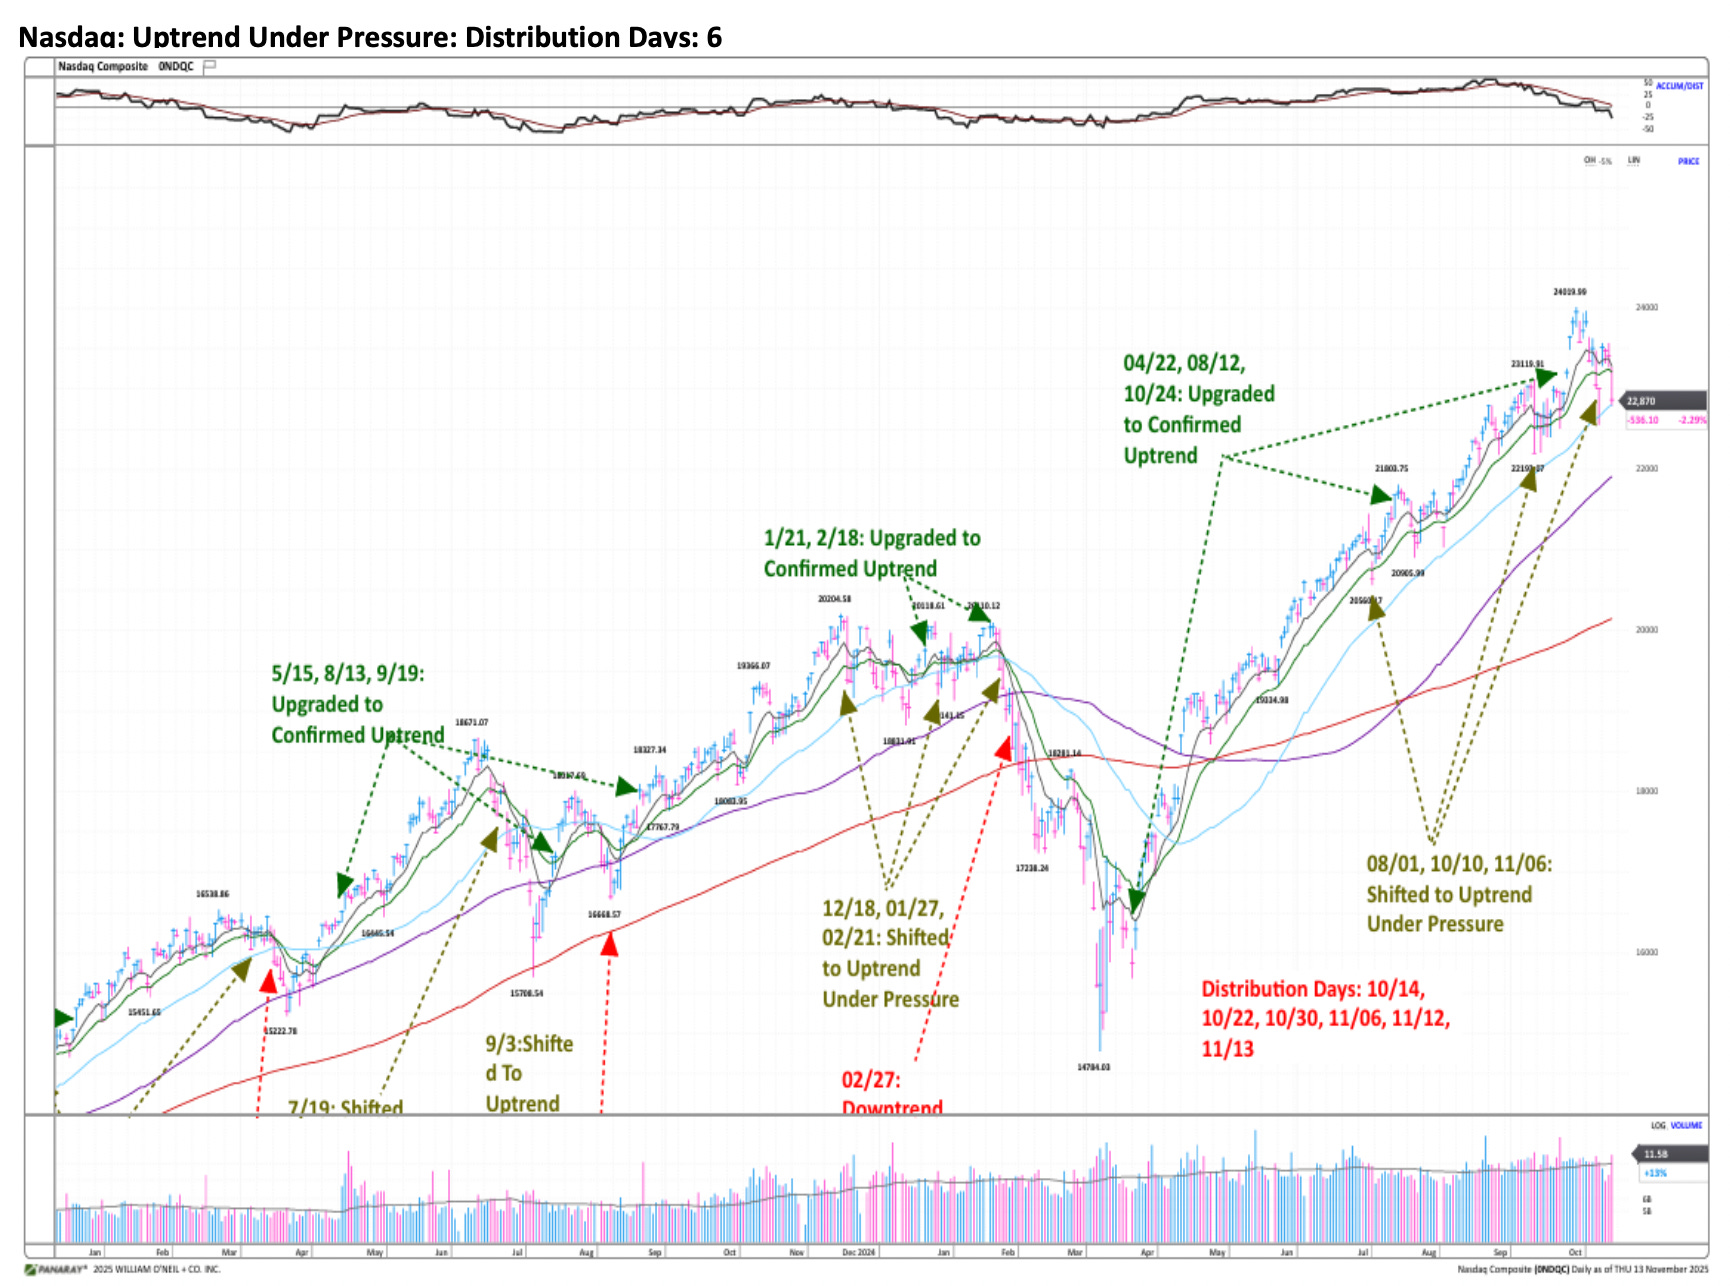
Distribution days are starting to rack up across major indexes with the Nasdaq posting 6 distribution days since October 14.
A distribution day is when one or more of the major indexes (primarily the Nasdaq Composite or S&P 500) closes down 0.2% or more in volume heavier than the prior day. (Volume does not have to be above average; just higher than the prior day.)
Investor’s Business Daily
Many individual stocks have already broken below their 50 day moving averages and are now testing their 200 day moving averages.
Magnificent Seven powerhouse Meta $META is now trading below its 200 day, down 23% from its all time high on August 14.

Keep in mind, the Nasdaq 100 rallied over 58% from the April 7 tariff crash low, a move that took roughly 204 days.
In our view, the current price action is normal but makes for a difficult trading environment as we have entered a phase of choppy waters and failed breakout.
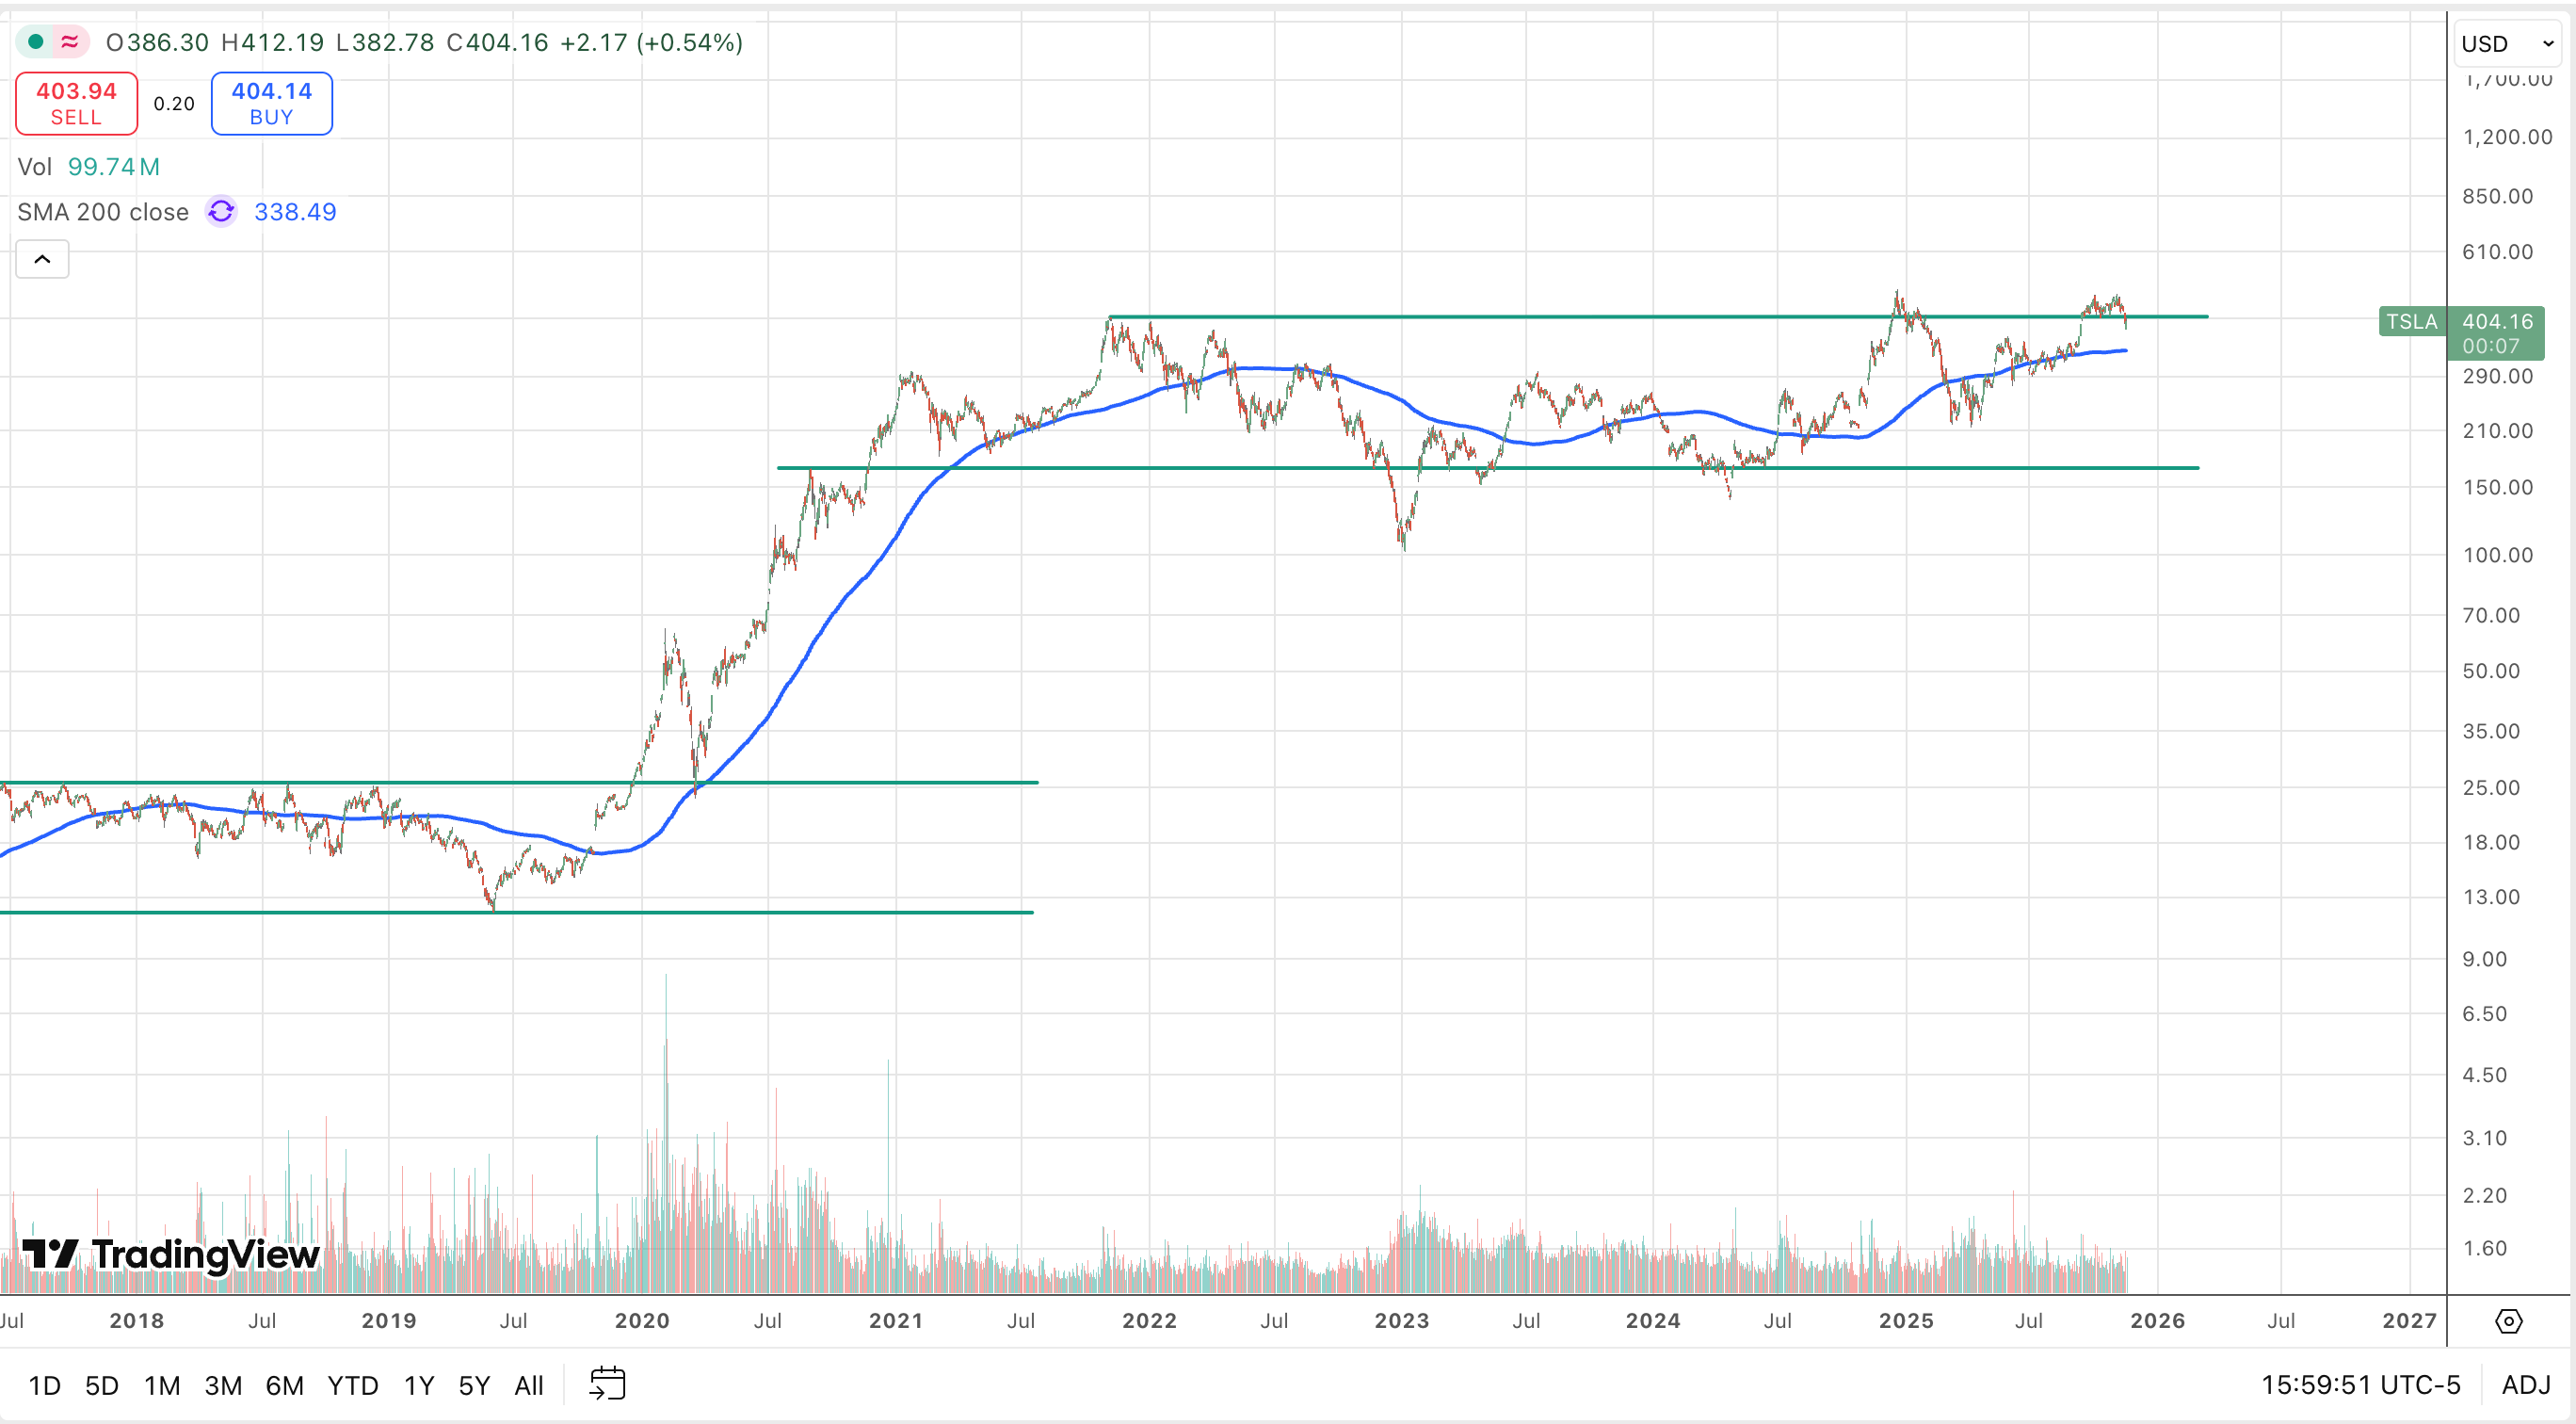
Tesla $TSLA broke down after attempting a breakout on the news of Elon Musk’s pay package approval.
The stock likely needs more time to build out a handle.
Don’t count it out, when it breaks out you must own this name.
Focus on stocks with leading relative strength and strong CANSLIM fundamentals; deviating from this disciplined approach in the current market environment increases your risk of being shaken out and losing money.
When the overall market is strong and trending, it naturally lifts most stocks, which can lead investors and traders to deviate from their disciplined strategies and invest in ideas that don’t meet check all the boxes in CANSLIM.
You might be able to get away with this when the general market is strong, however when the market starts to pull back or even starts to go range bound, those are the first stocks to get sold and sold down hard.
Biotech Boom / Pharma Boom
There are a few notable stocks that stand out as the market experiences turbulence and individual names within leading groups pull back.
Eli Lily $LLY is showing glaring RS, managing a successful breakout from a flat base leading into new record highs.
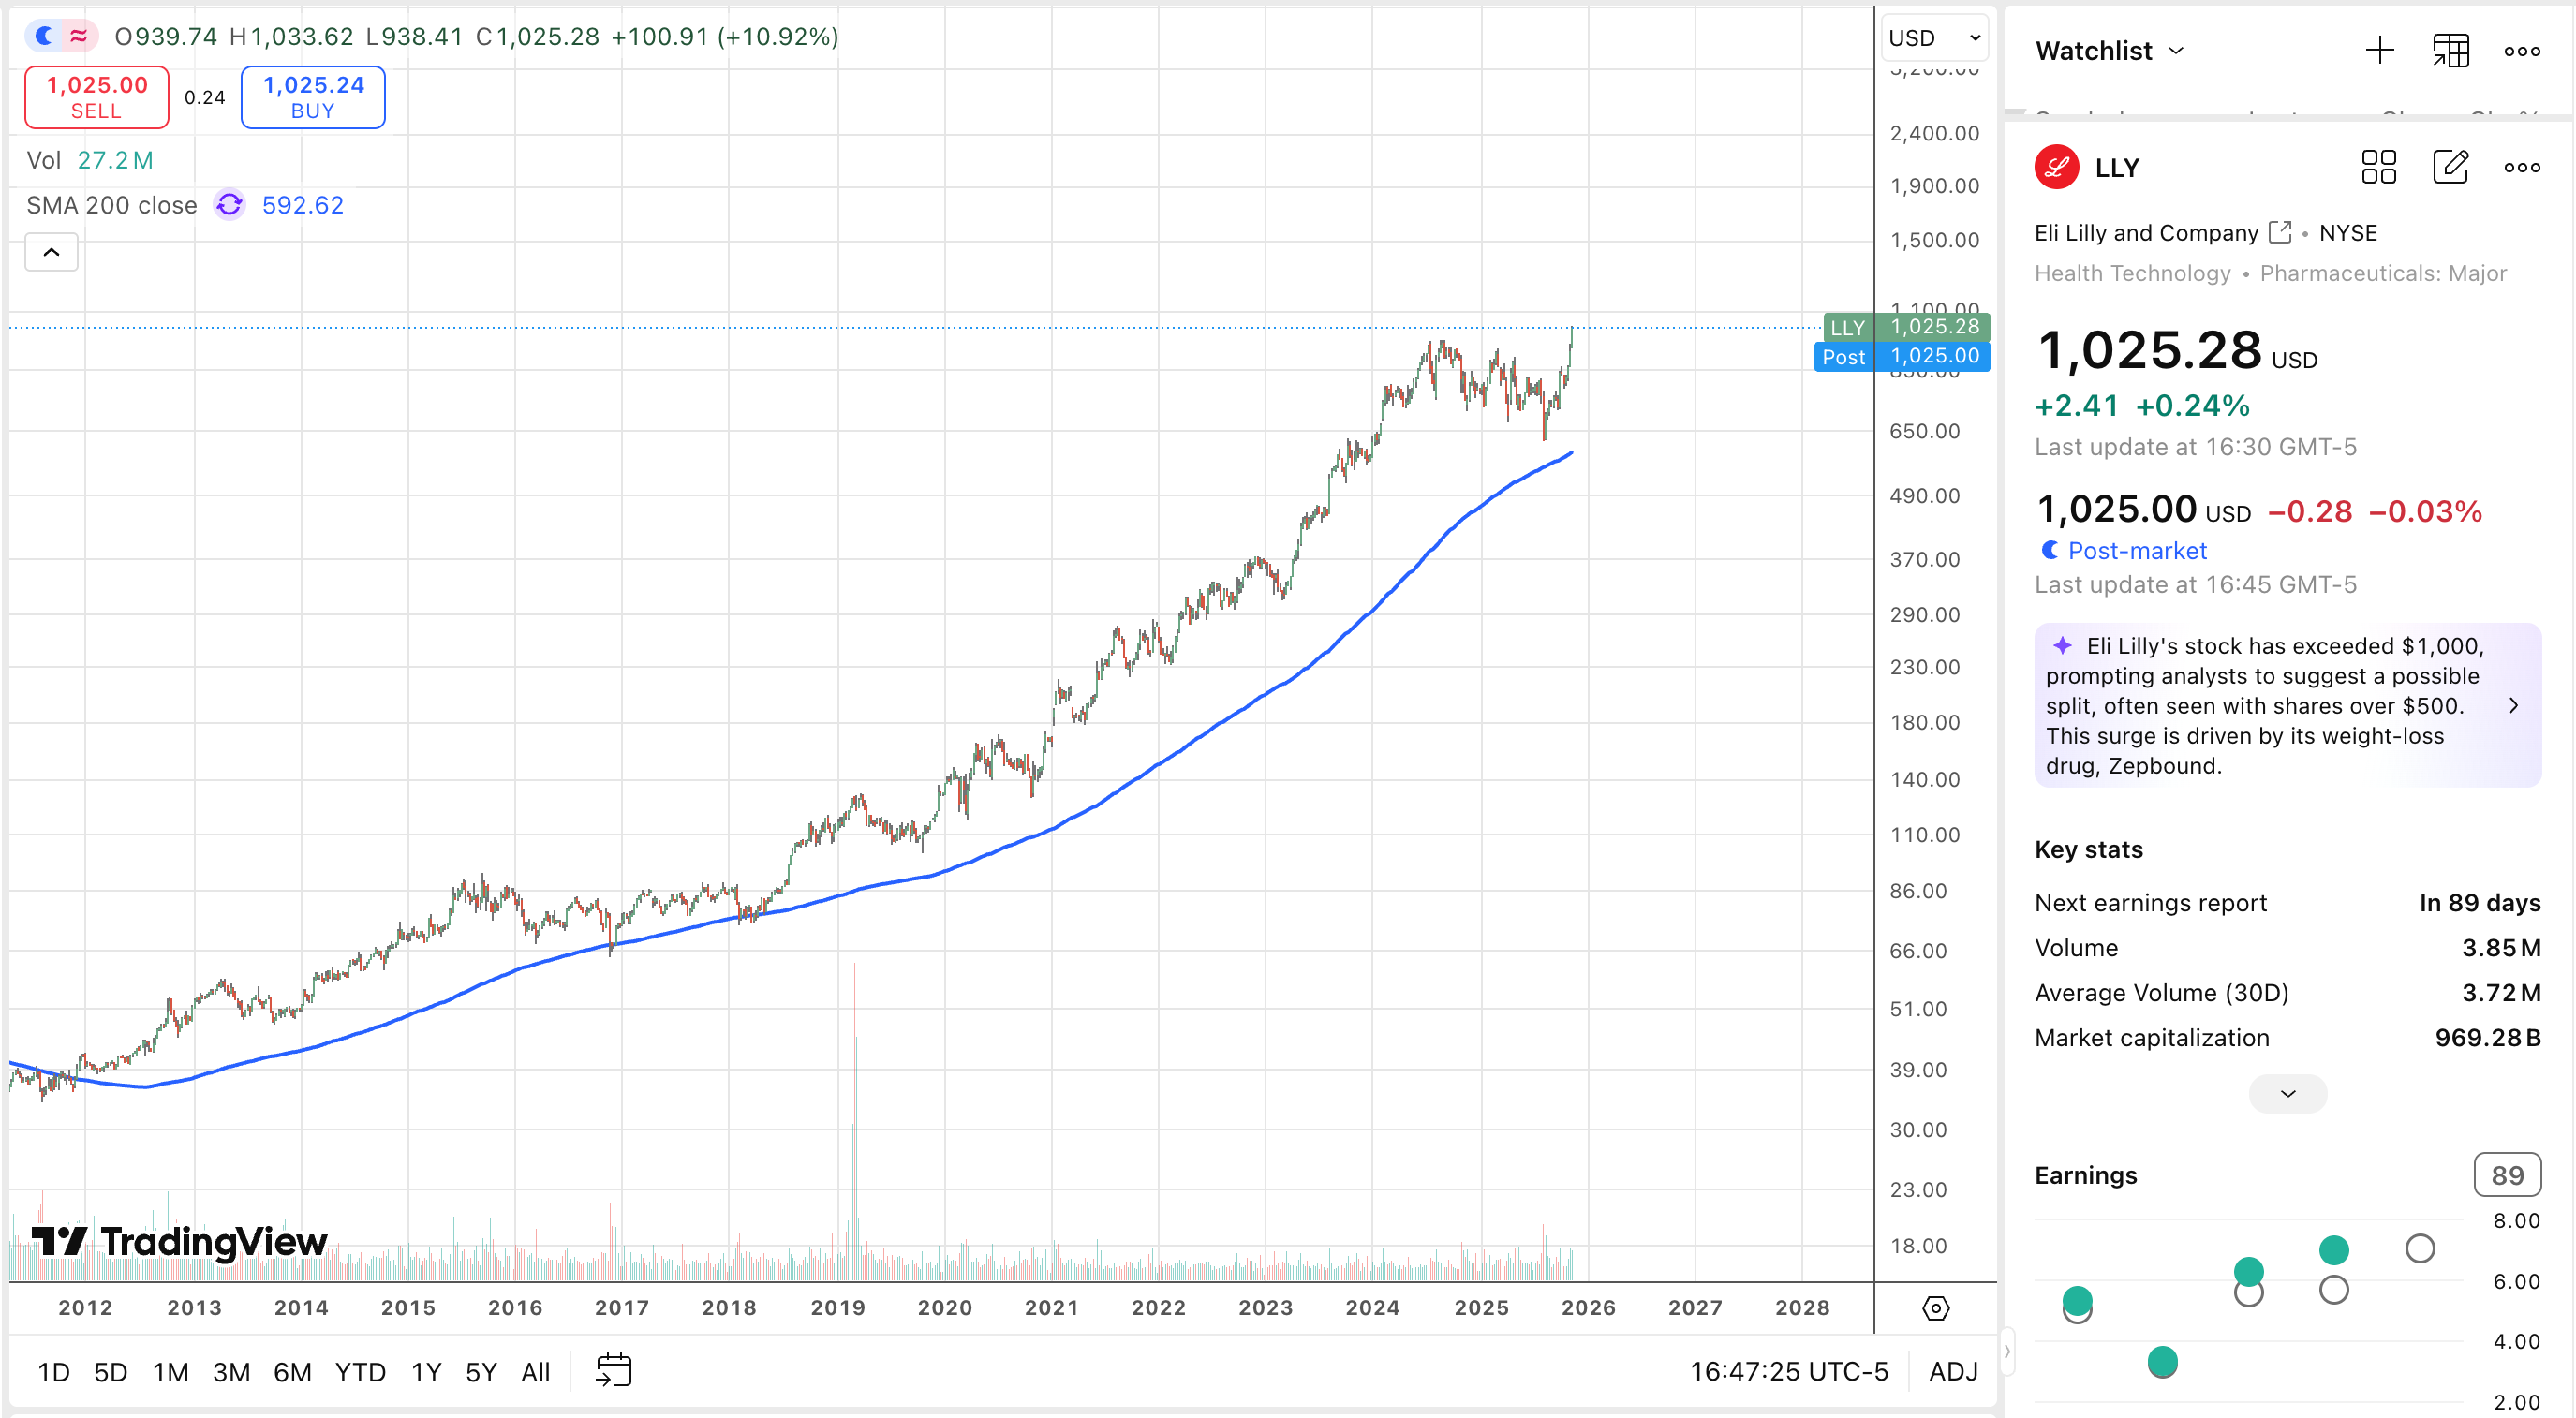
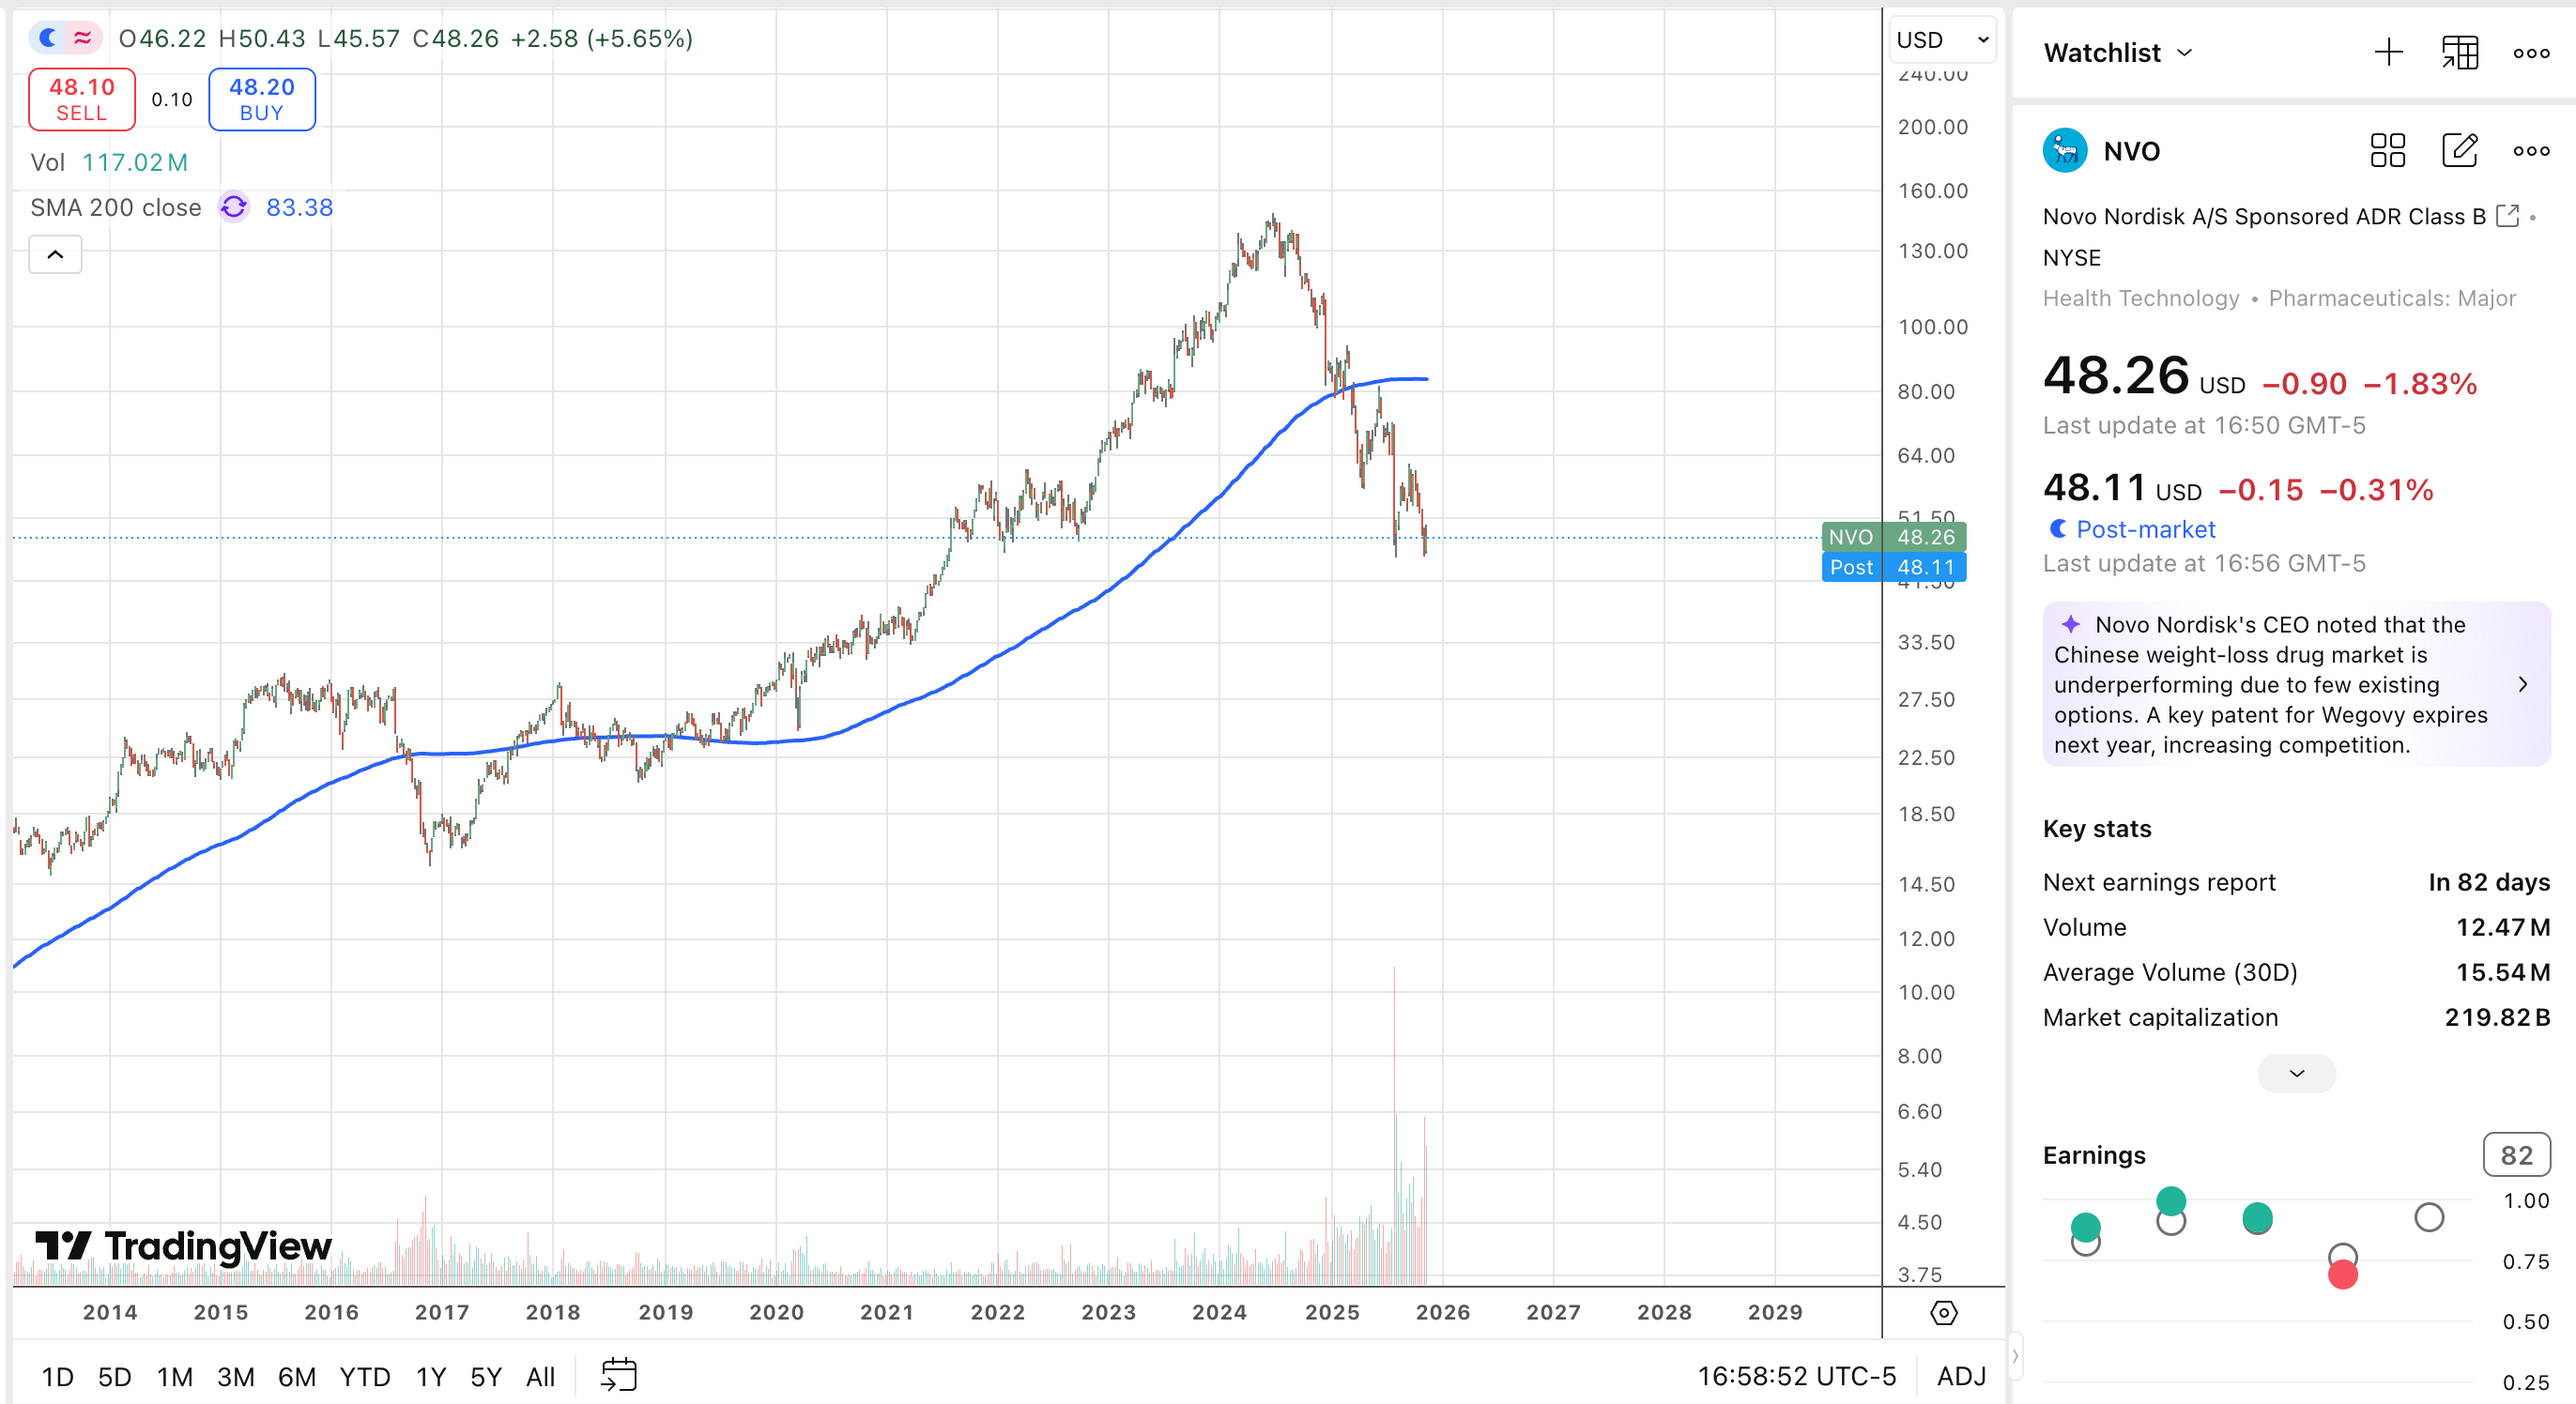
The group leader will go on to outperform the second and third best stocks in the group by large multiples. Novo Nordisk, a competitor to Eli Lilly, is lagging significantly behind.
Go right to the stocks with leading RS as that will point you to the names being accumulated by institutional players.
Based on price action alone, Eli Lilly appears positioned to lead the weight loss drug race. If an oral pill option becomes available within the year, we expect Eli Lilly to significantly expand its market share.
The biotech sector is outperforming after enduring a multi-year bear market that began during the growth stock sell-off in 2021.
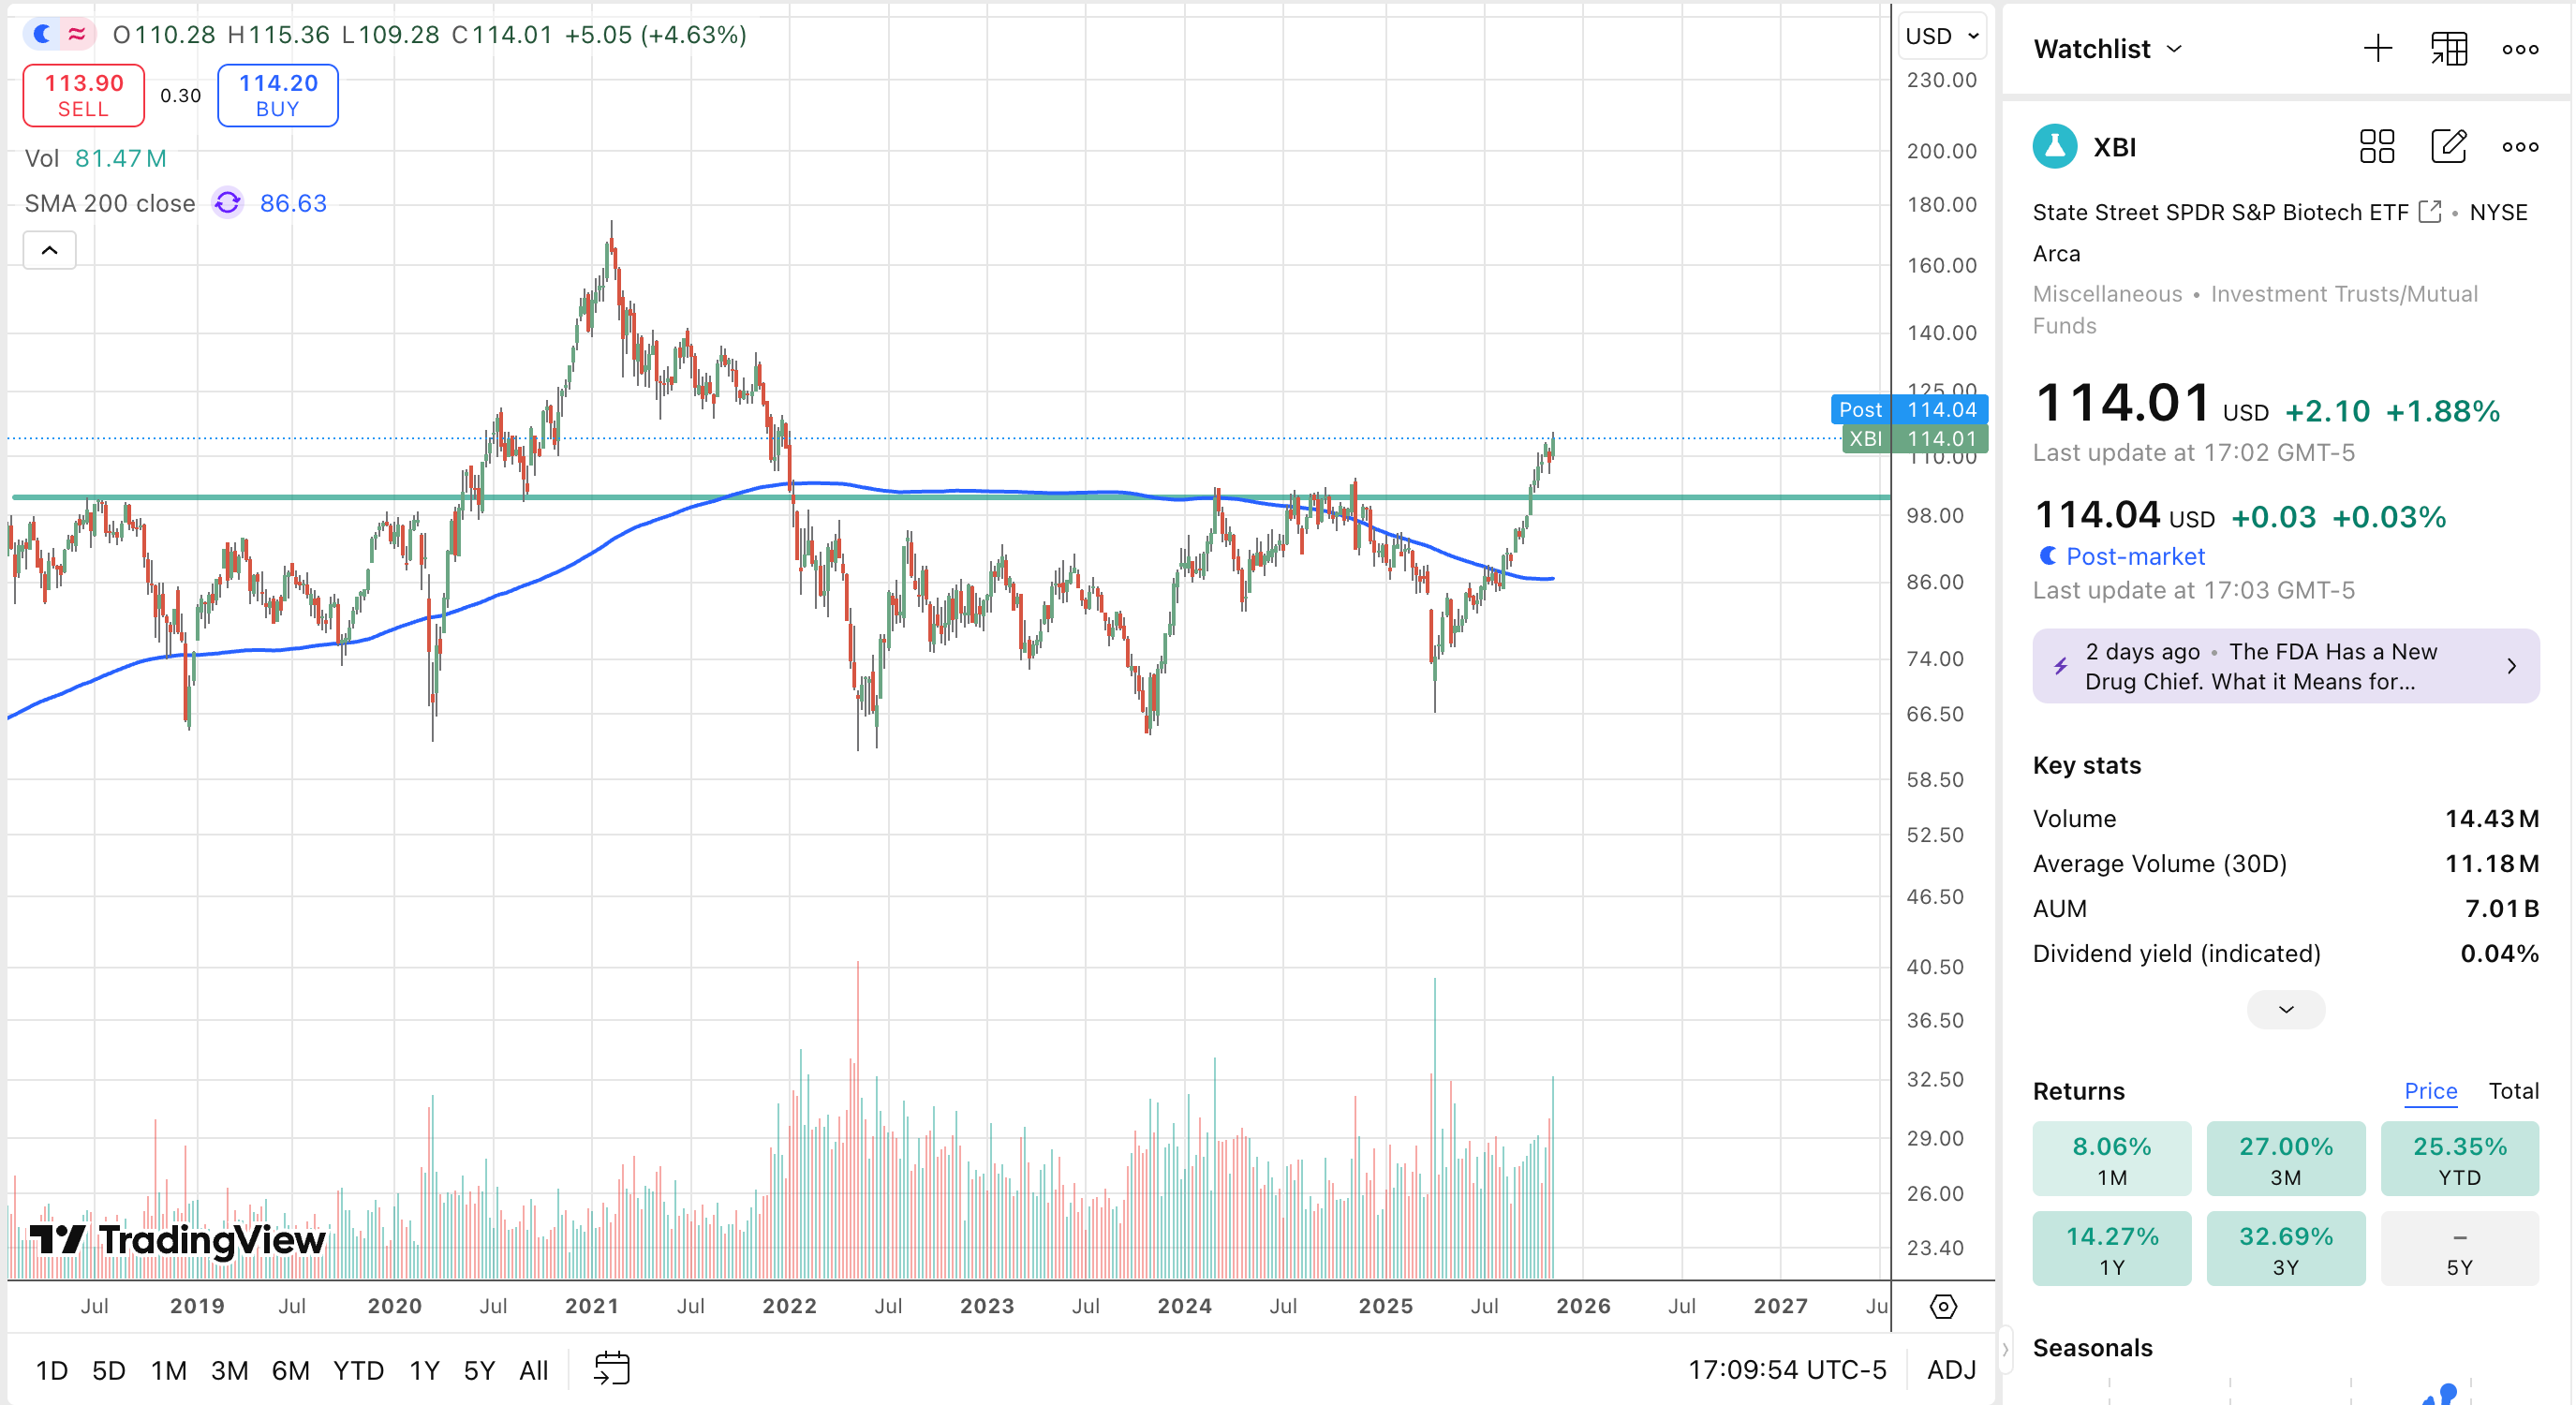
The $XBI State Street SPDR S&P Biotech ETF is breaking out above a multiyear flat base, potentially signaling the start of a larger move.
Artificial intelligence is expected to provide significant tailwinds to the sector, driving major breakthroughs and potential cures.
Axsome Therapeutics $AXSM is staging a highly encouraging breakout from a flat base, moving into new high territory.
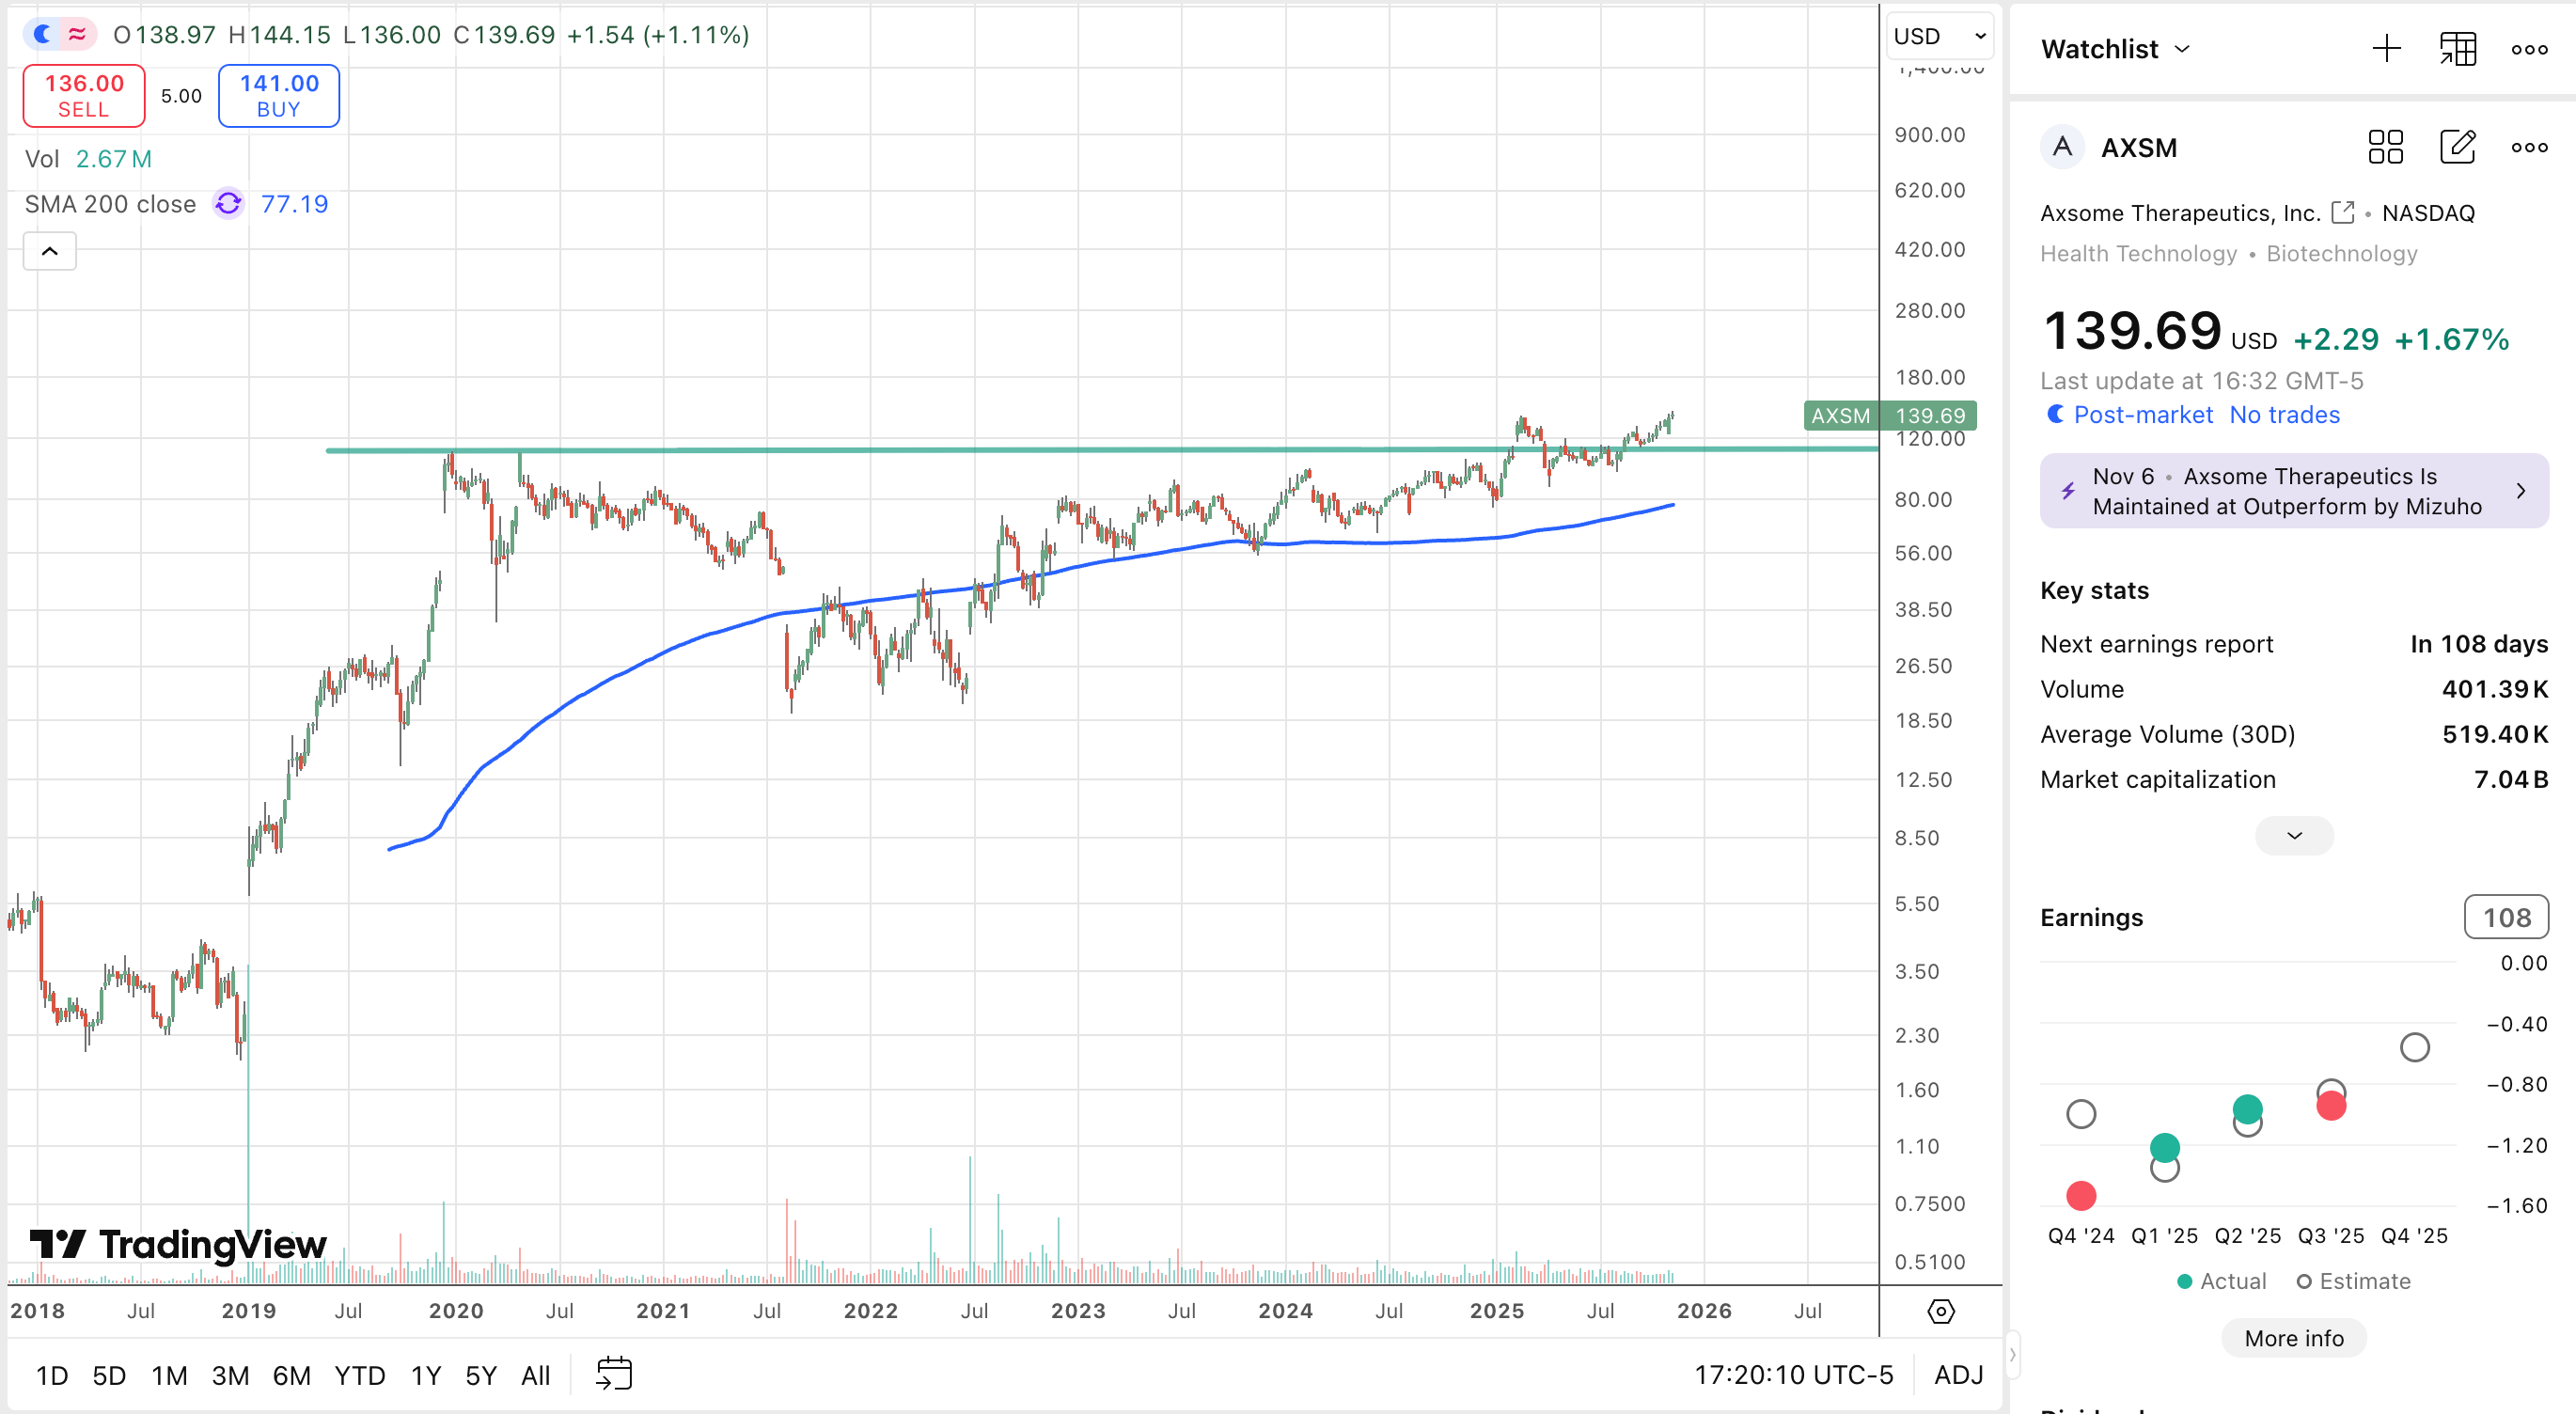
Again you will notice how all of these names are leading into new highs, focus on strength and avoid bottom fishing.
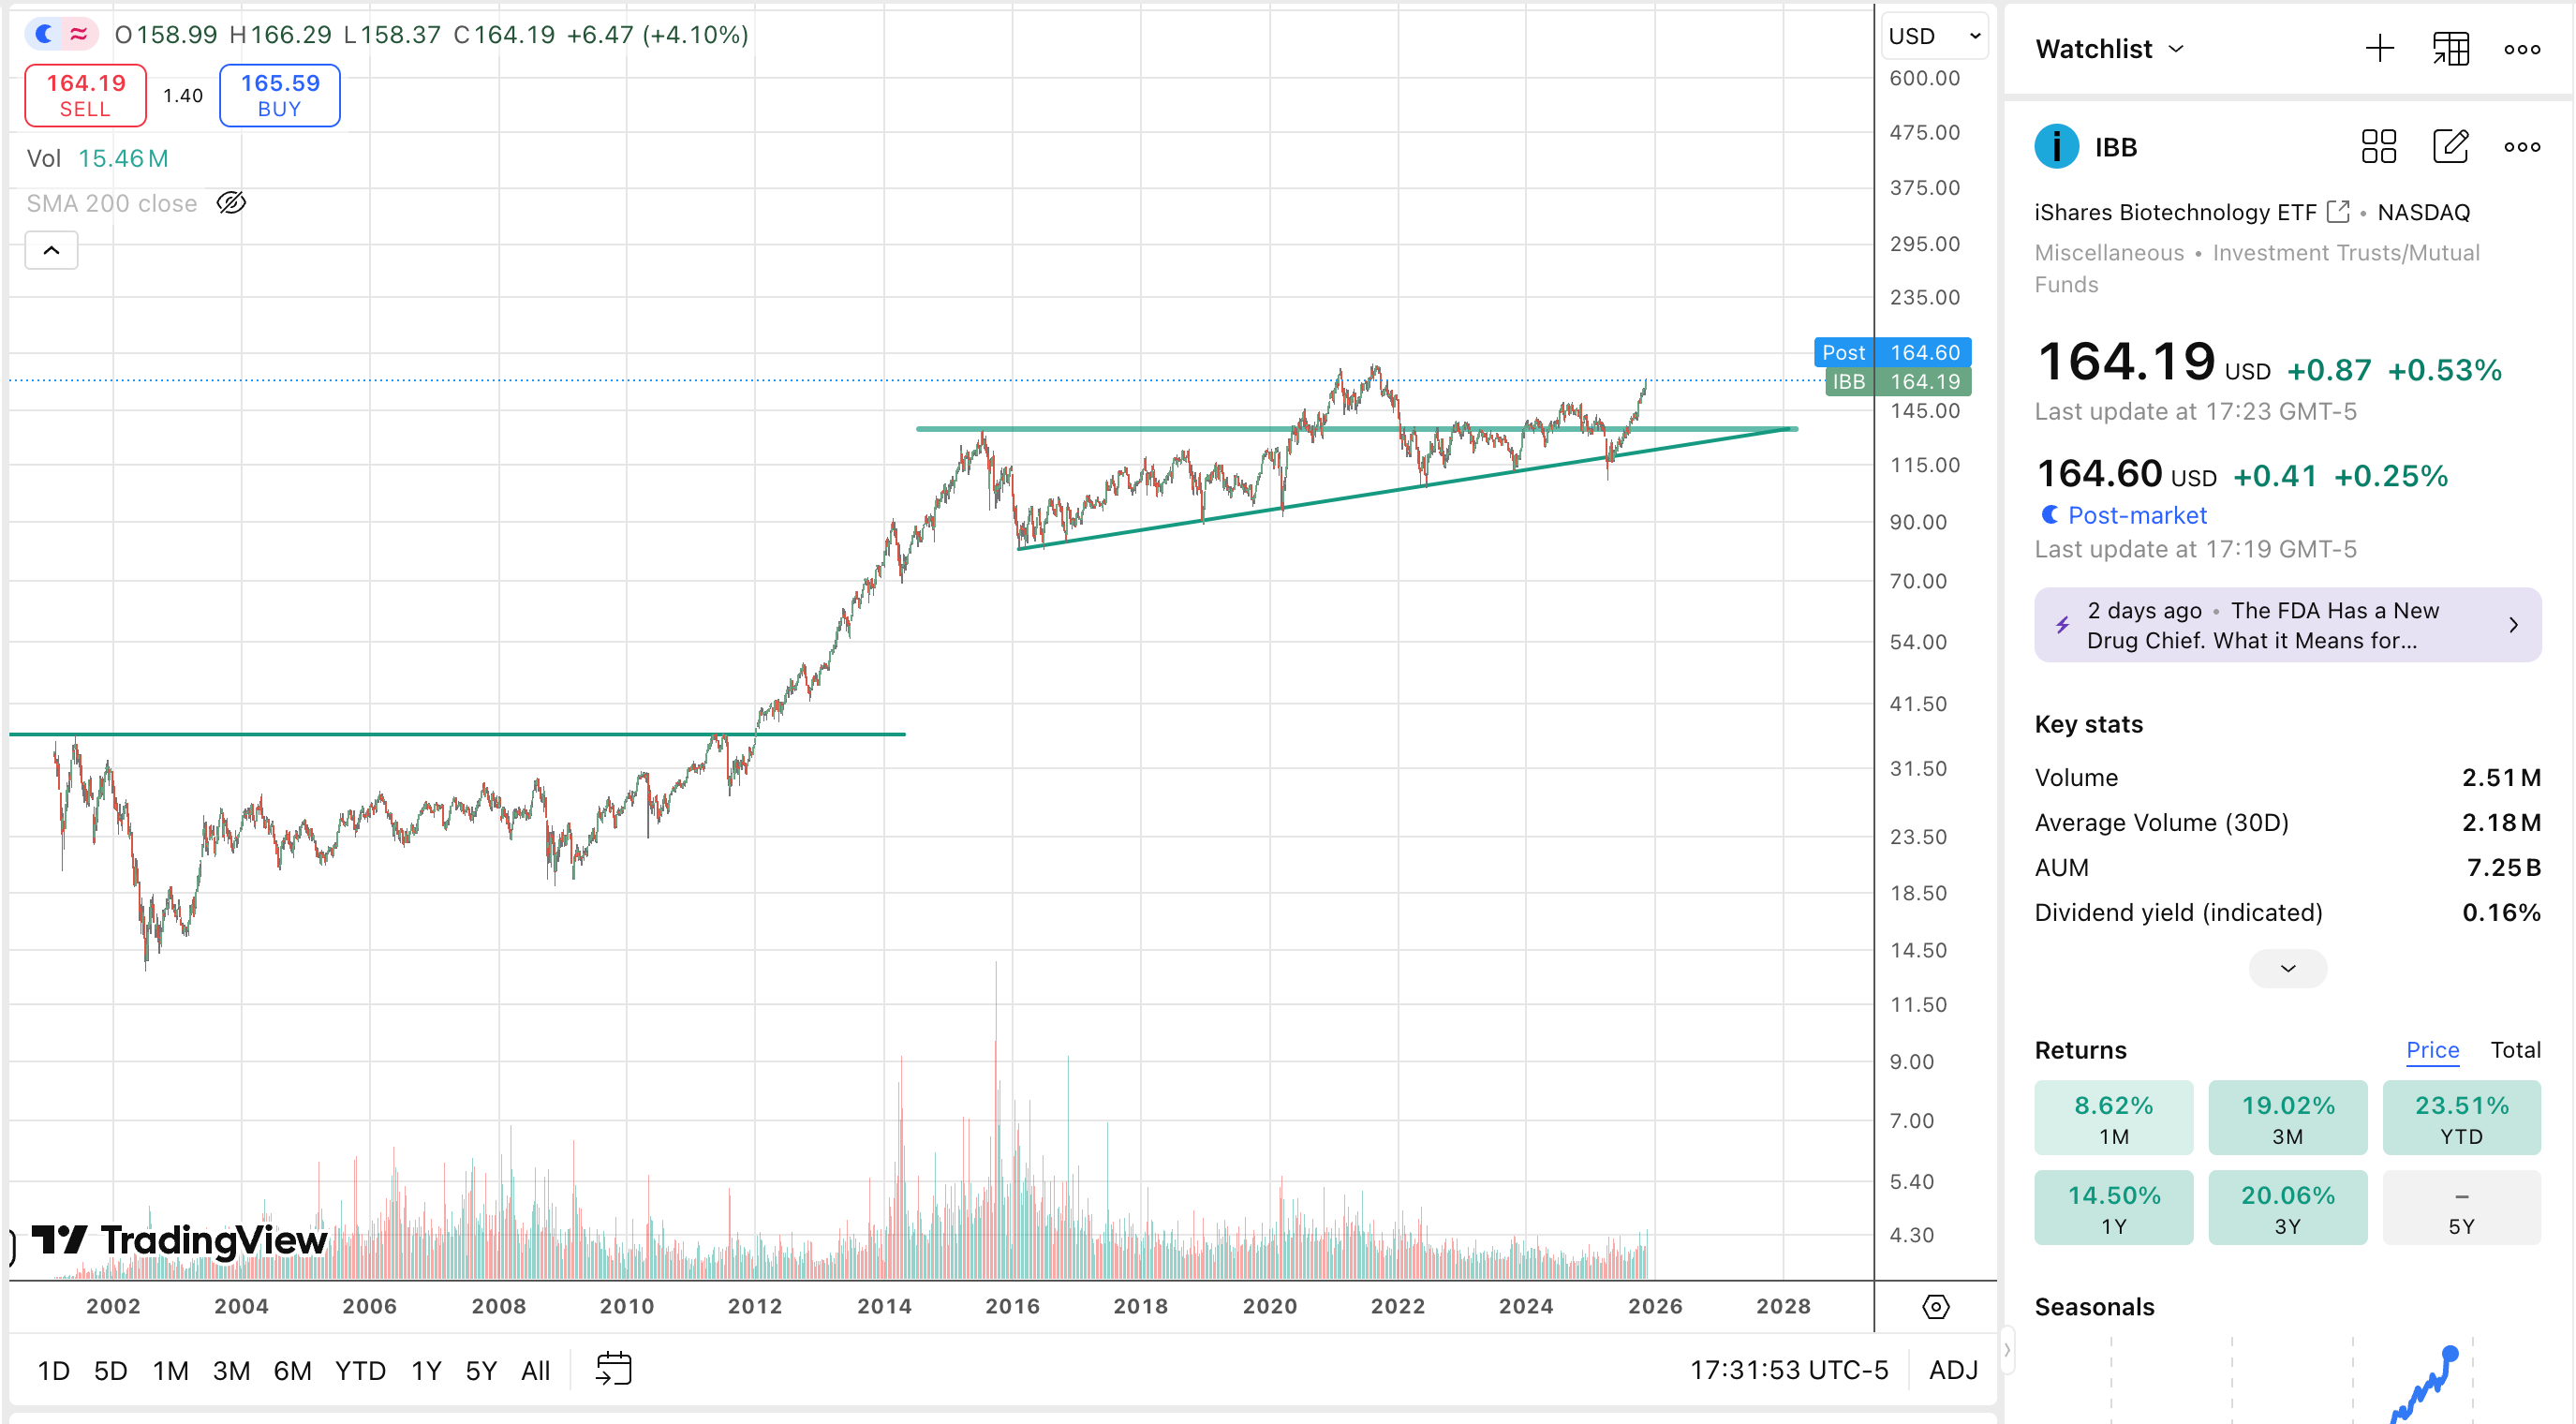
The iShares Biotechnology ETF $IBB is also attempting a breakout into new record highs after a multi year base.
A break into new high territory could spark a multi year bull market in the sector.
Bitcoin Under Pressure
The crypto markets have come under pressure, with Bitcoin breaking below its 50 day moving average and now trading well under its 200 day moving average
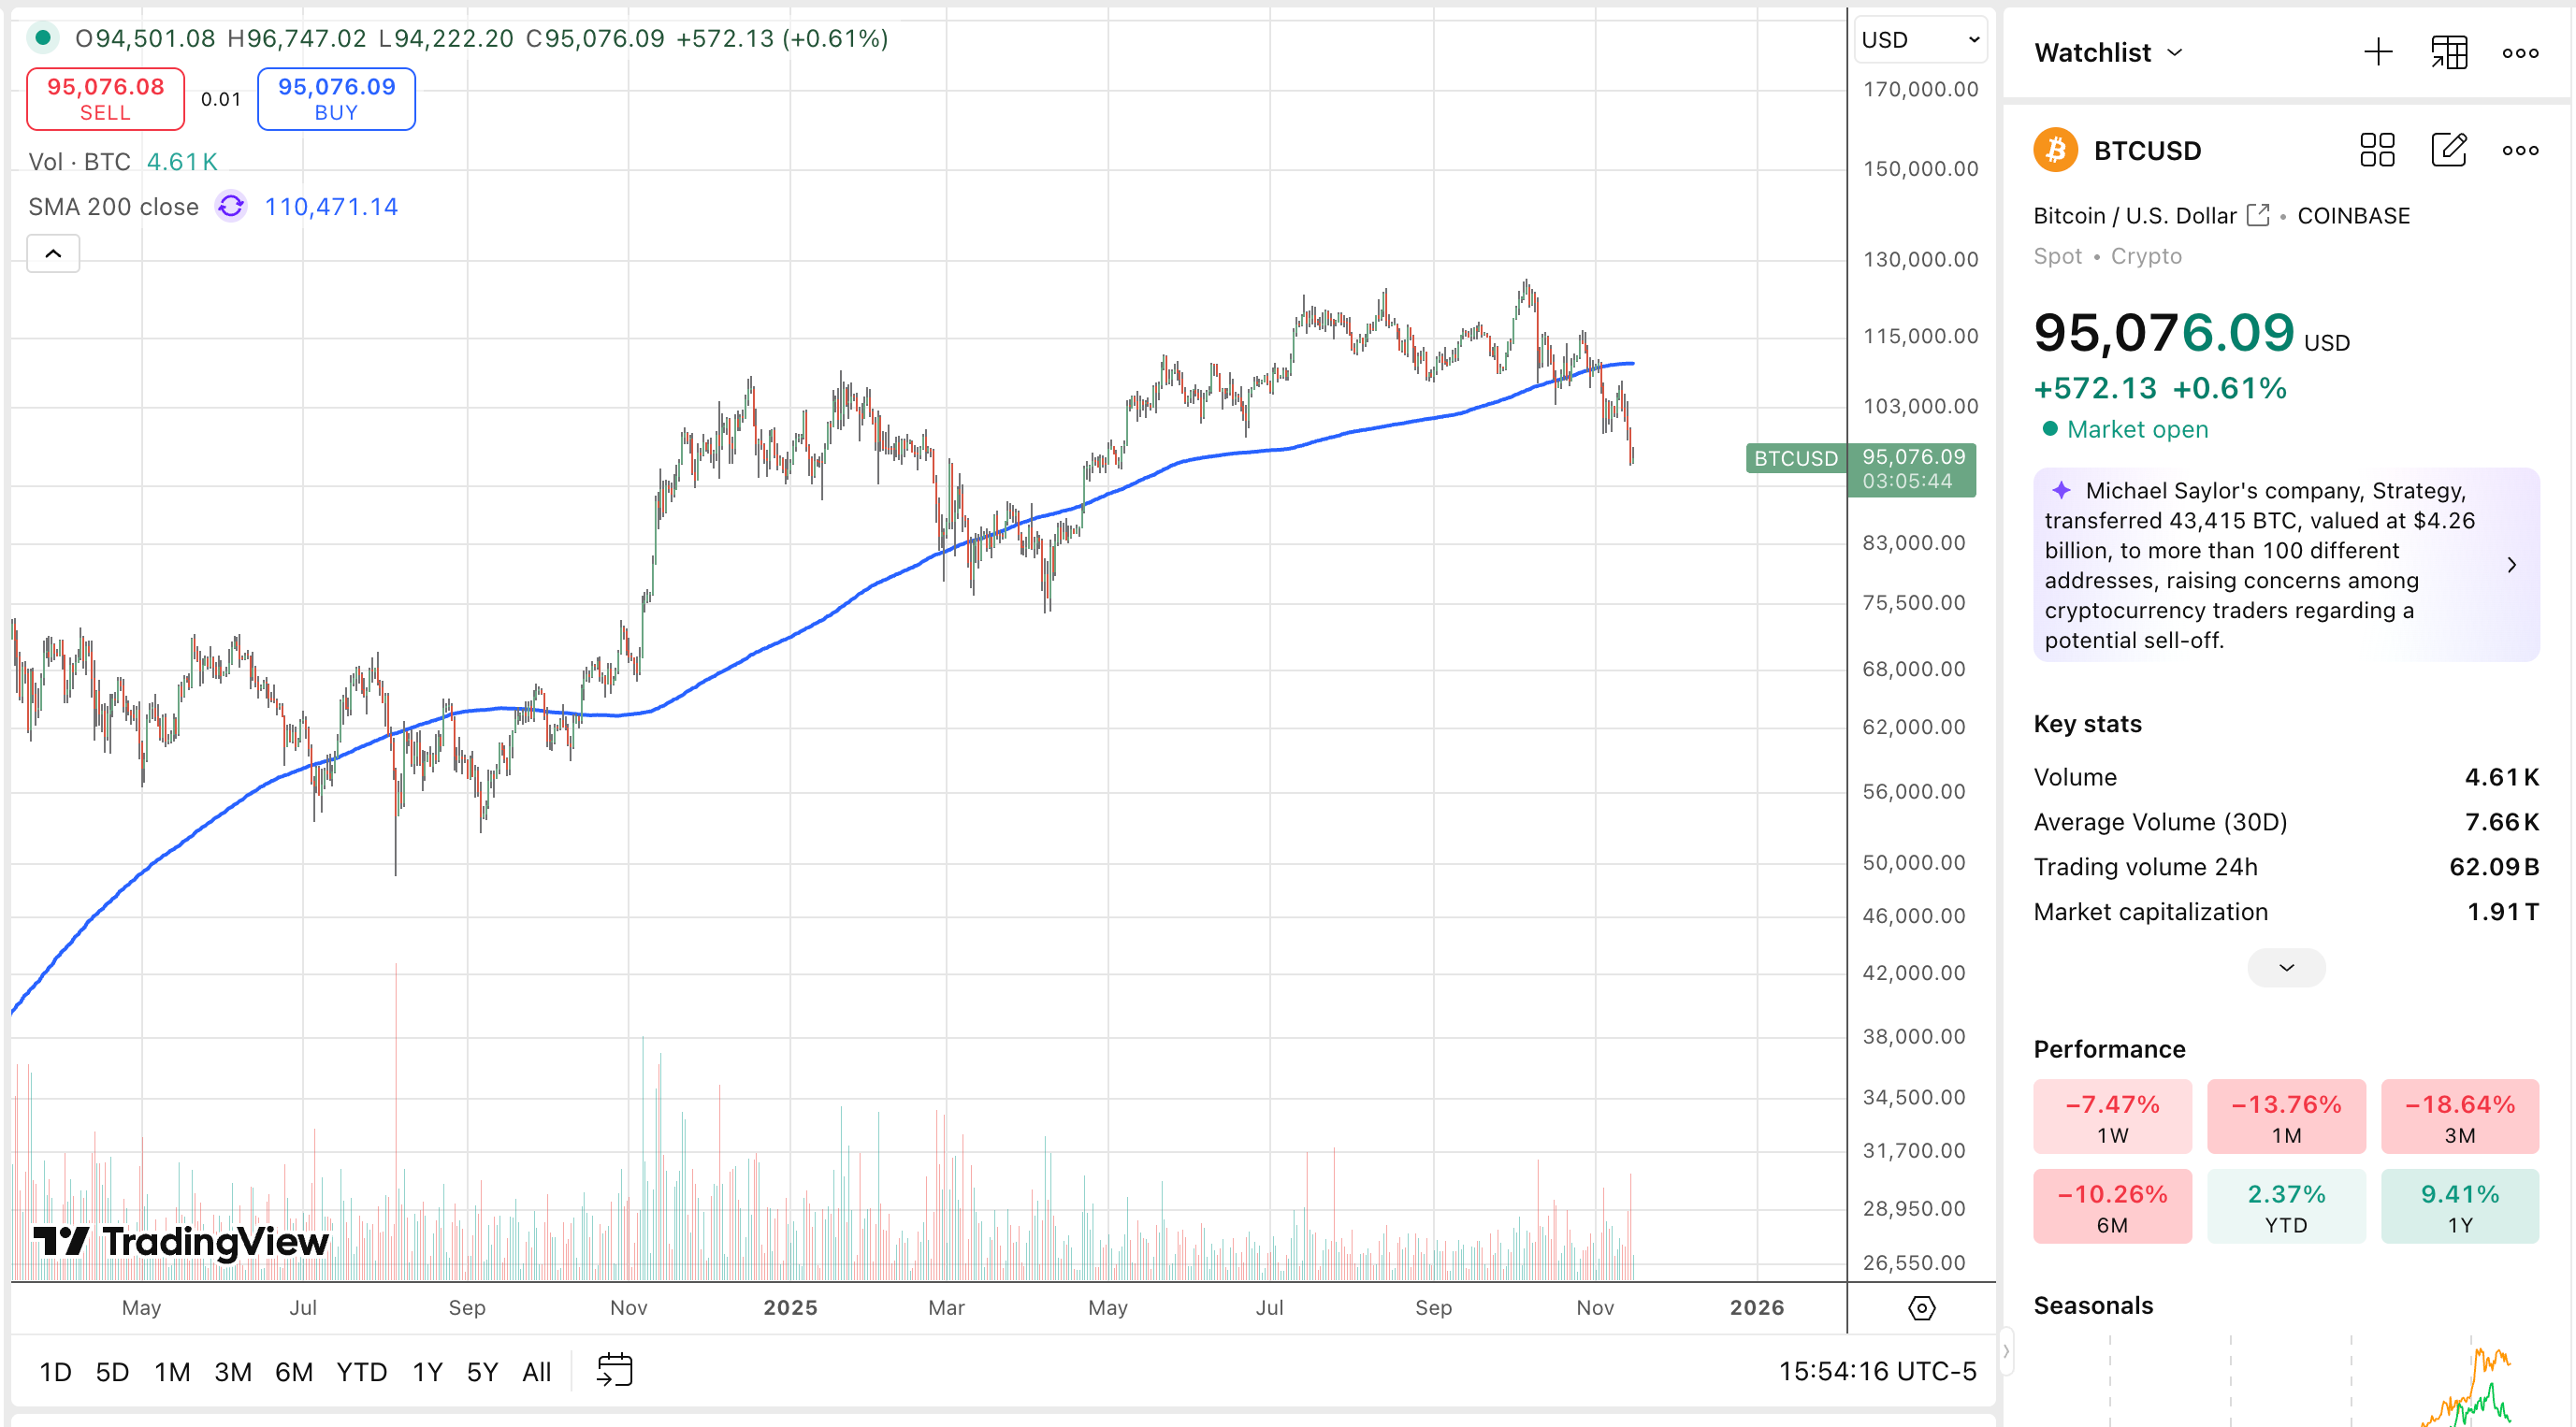
Just as with equities, the overall weight of the general market exerts its influence on the sector as a whole, it is difficult to fight the trend.
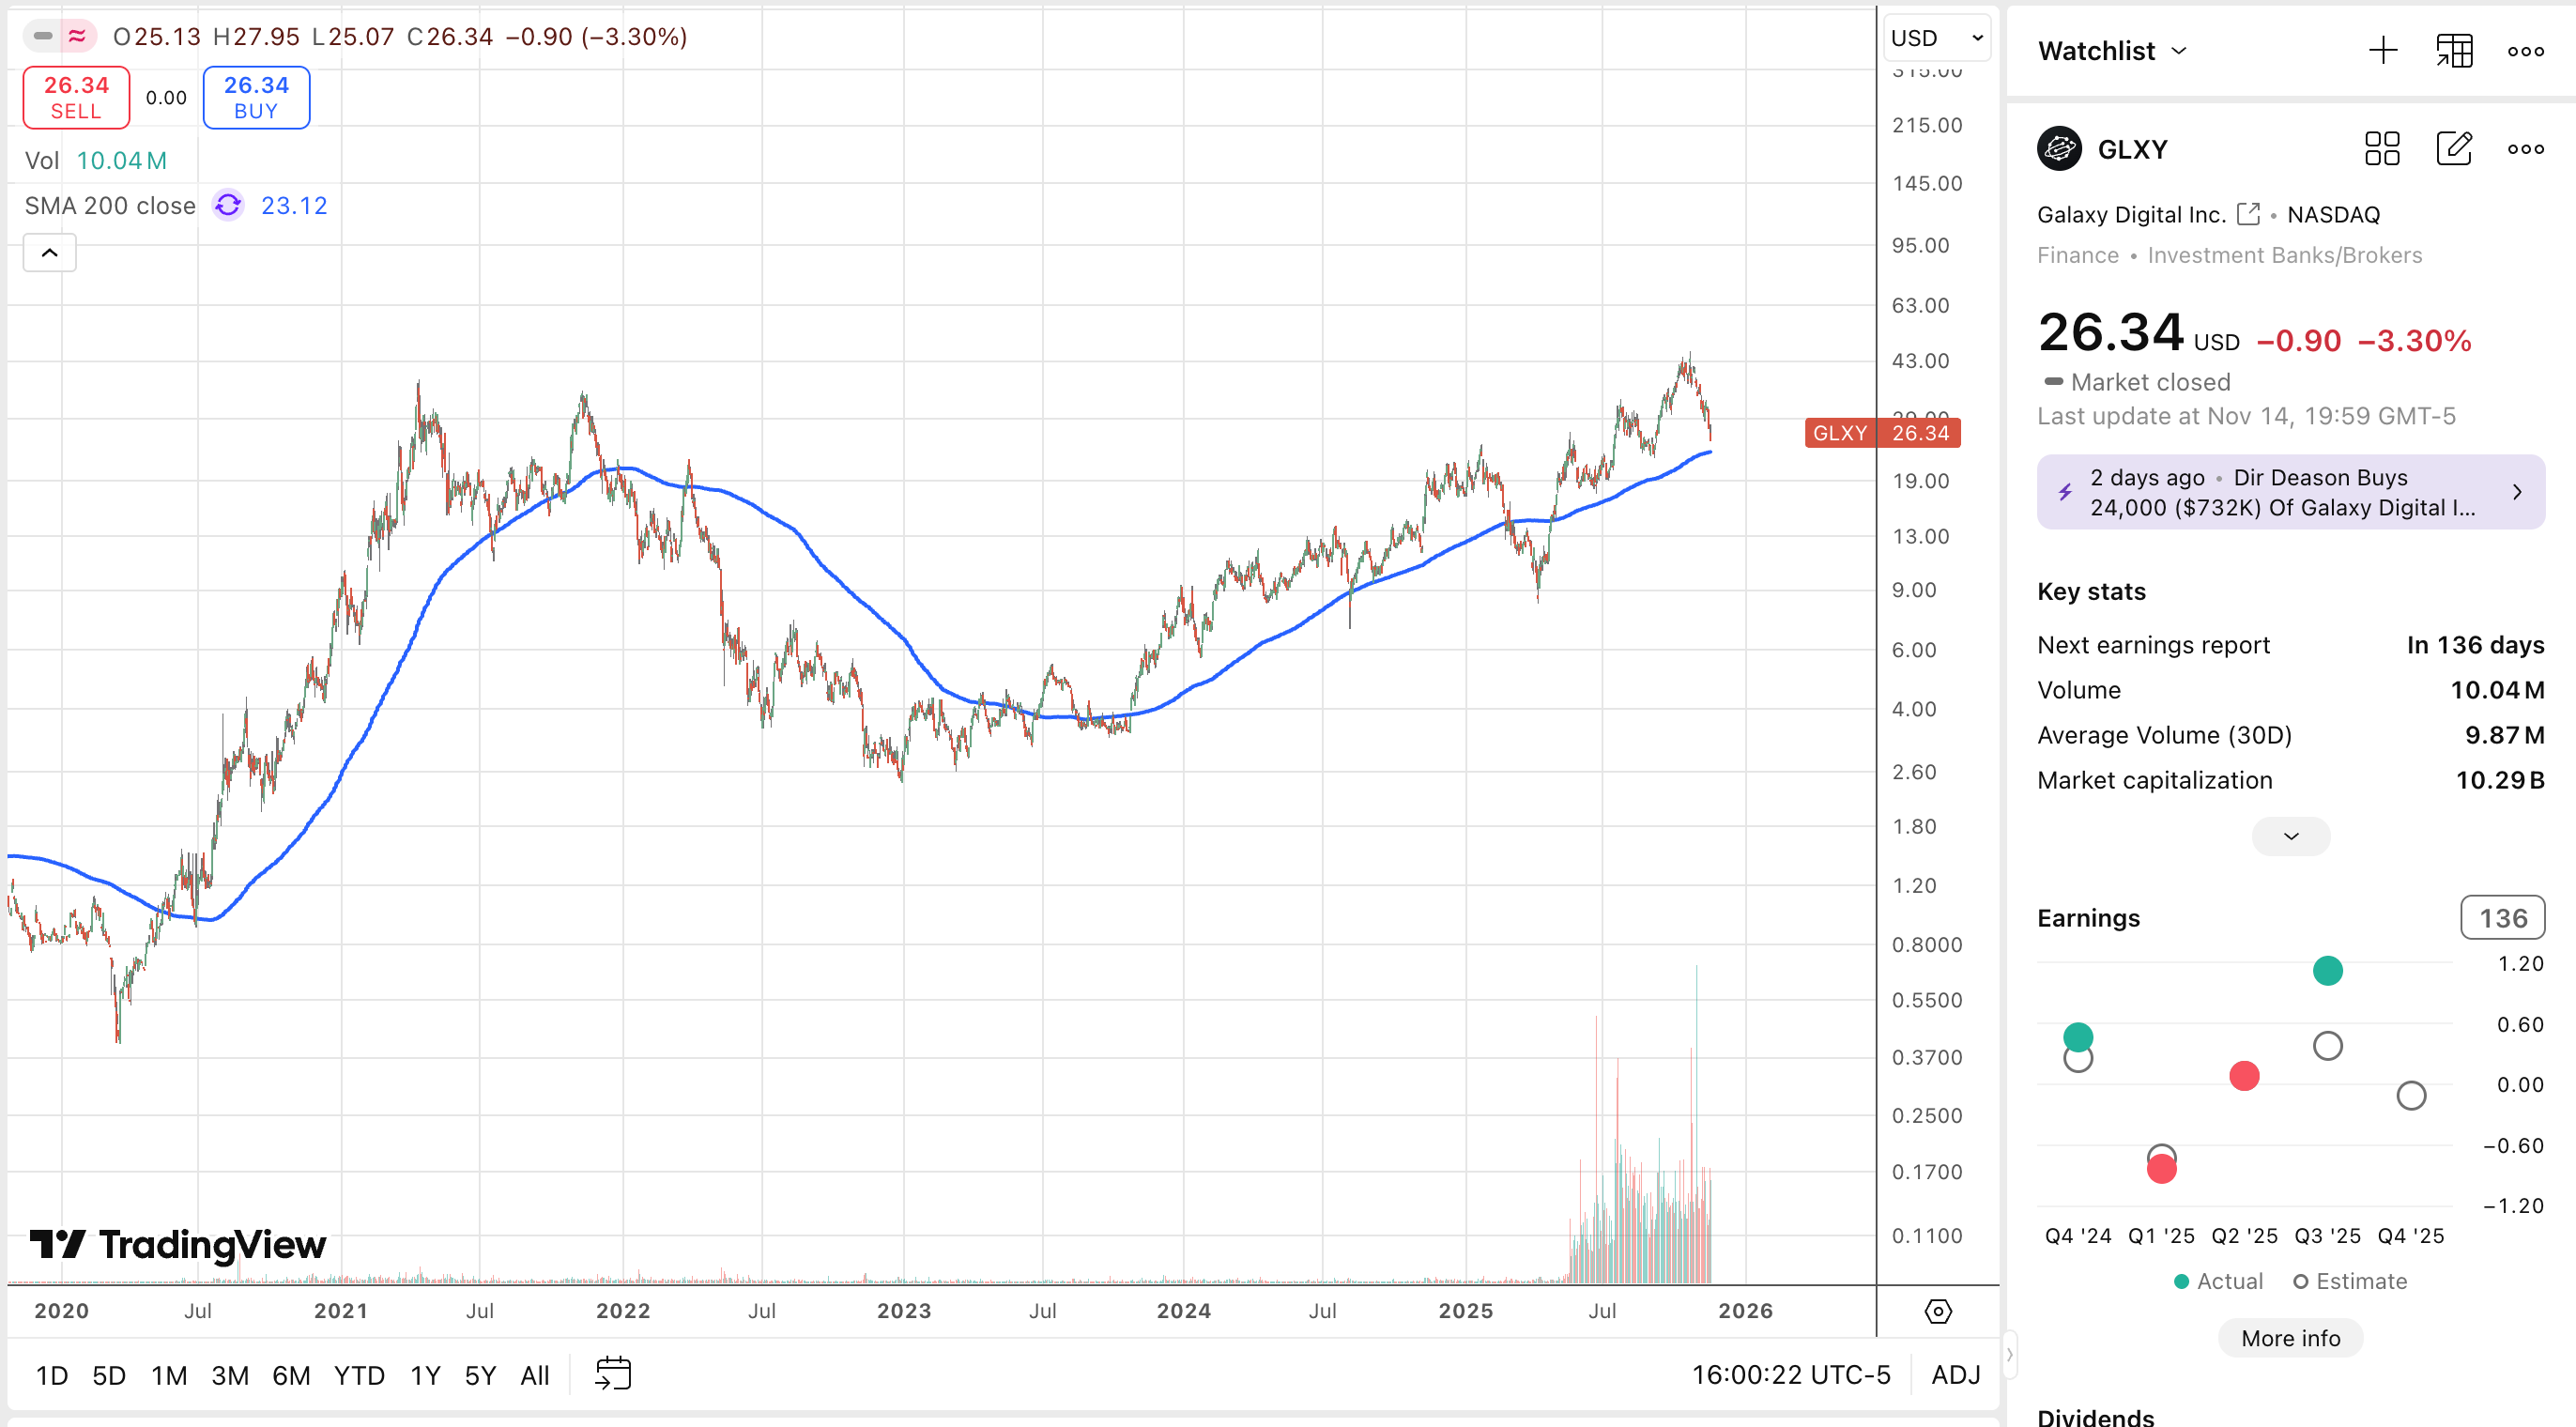
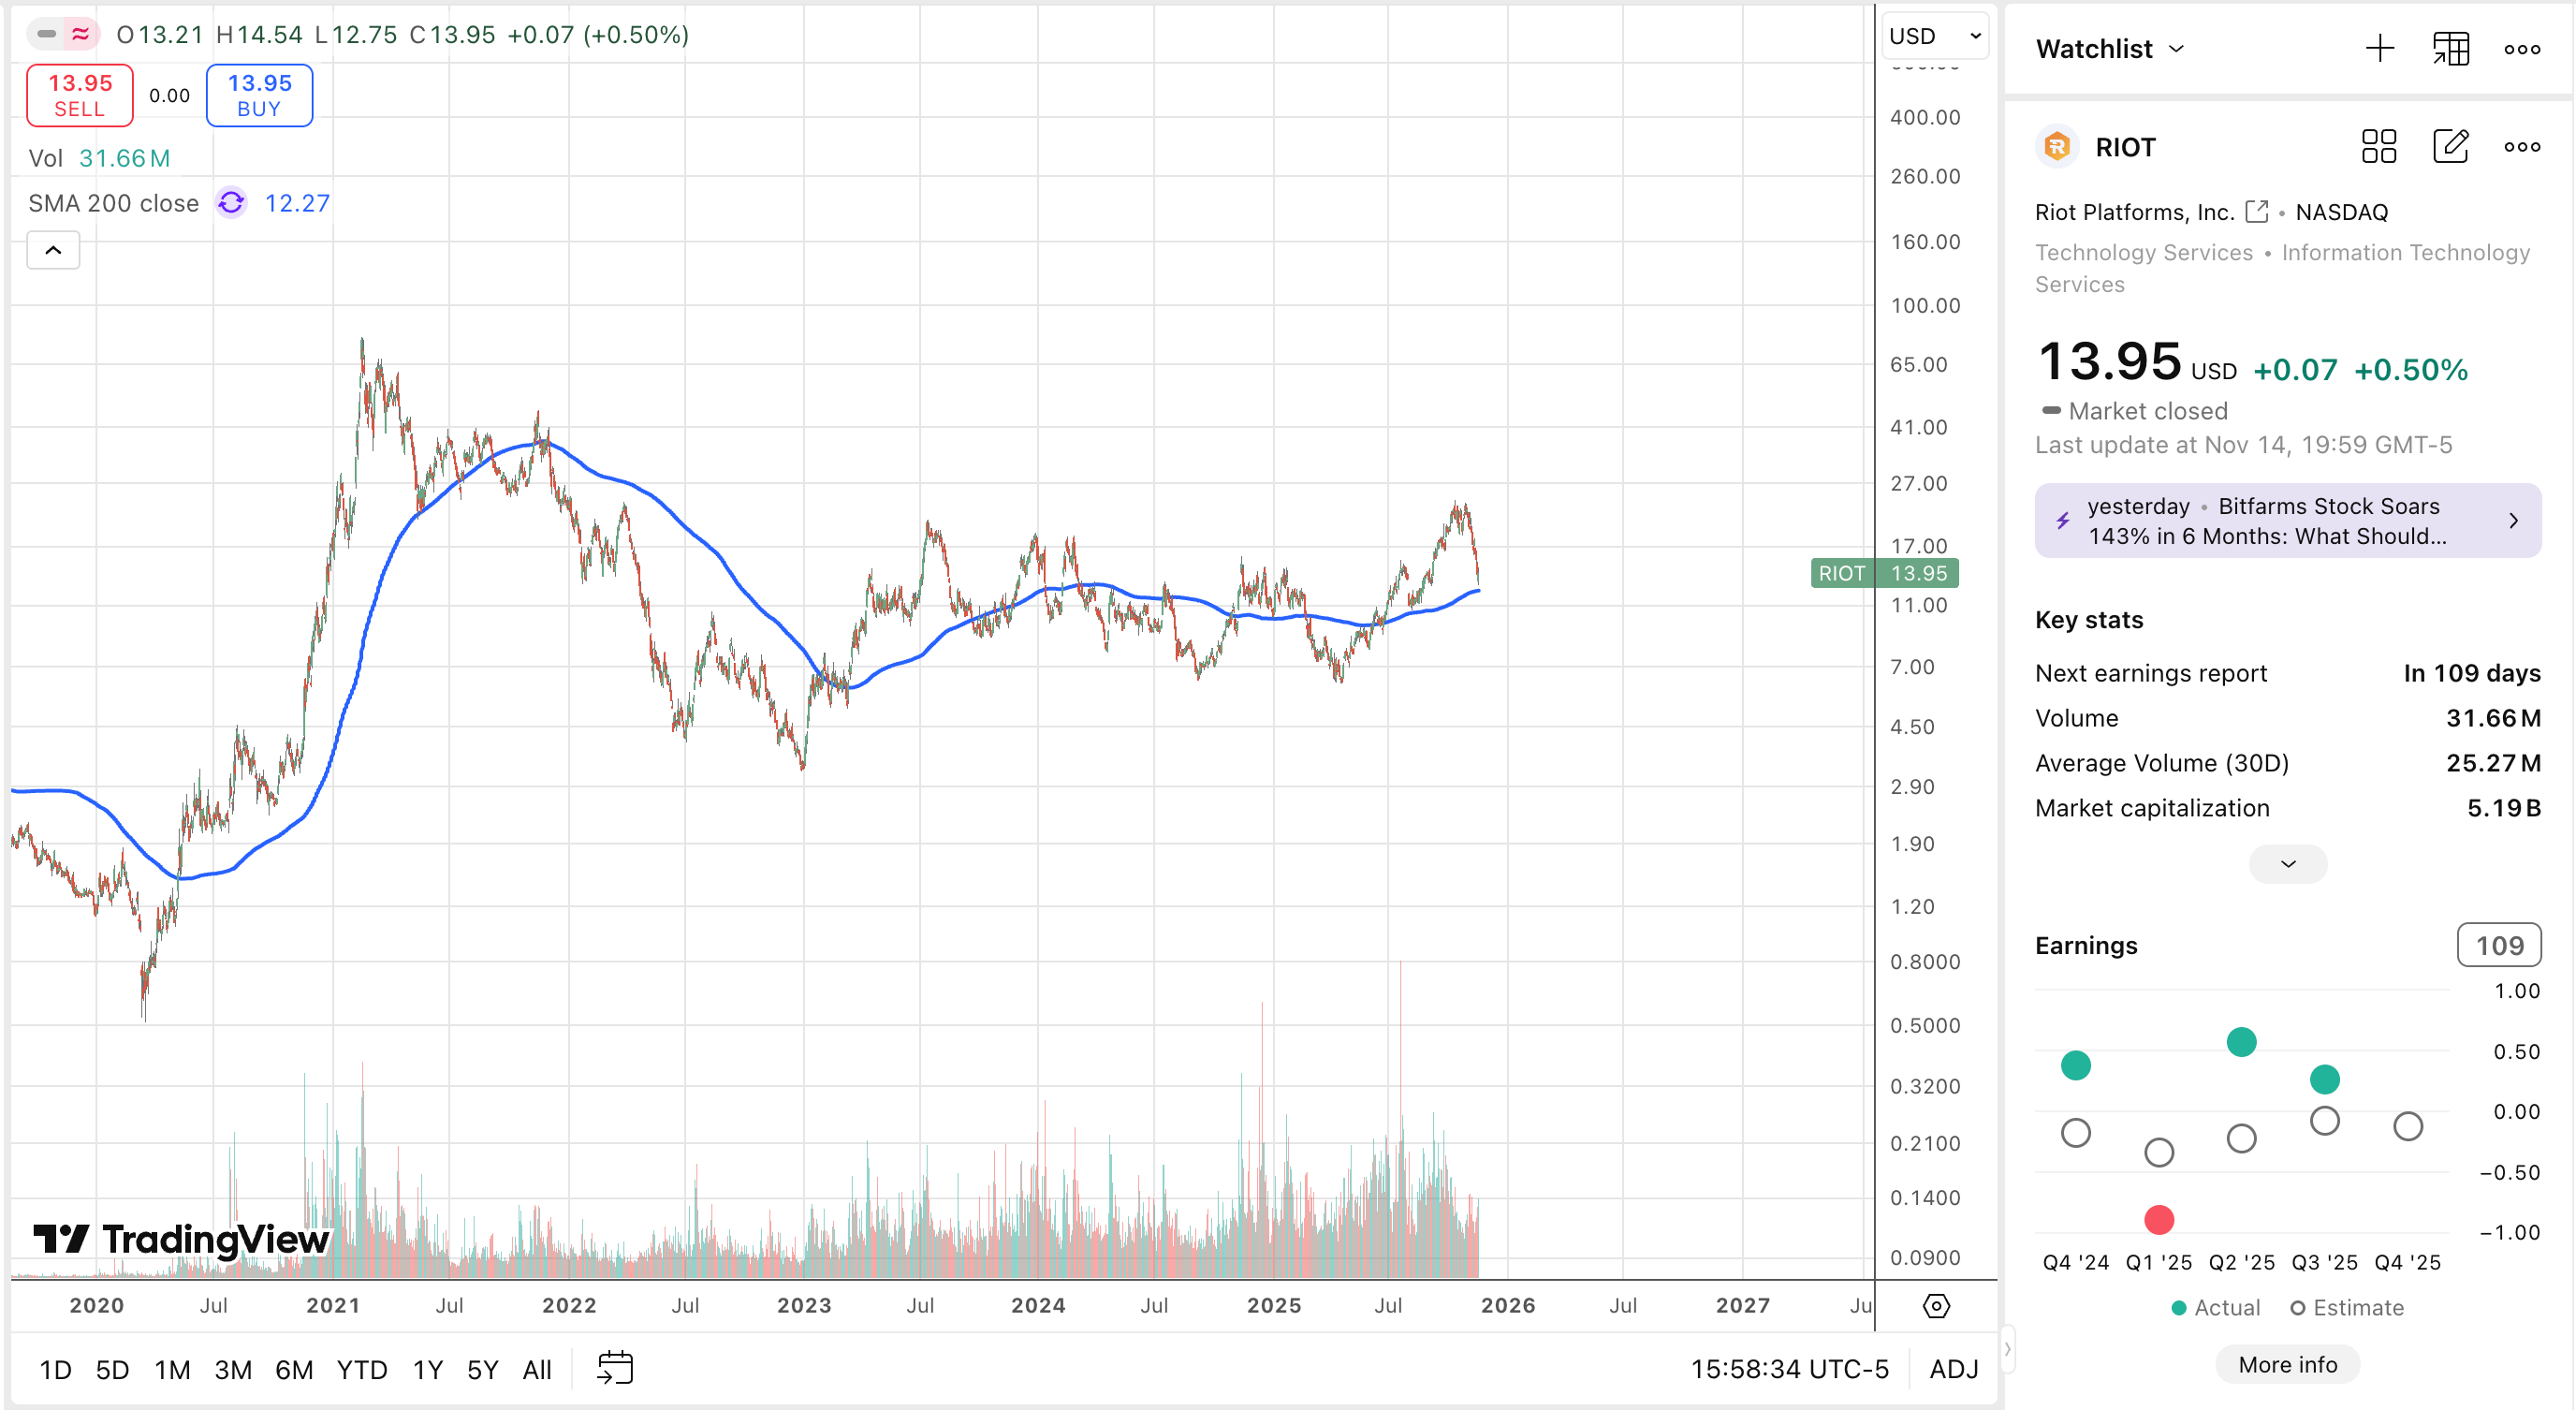
Most crypto and Bitcoin mining related stocks have declined 40% to 50% from their previous highs, with $GLXY standing out as one of two stock in the group trading above its 200 day moving average.

$IREN, the sector leader, is down 38% from its record highs.
The two top names in the group have significant data center exposure, aligning with the major themes in this AI driven bull market the critical importance of energy and data centers.
As stocks pull back, it’s important to emphasize the value of holding THE leader in a group. It’s often better to sell a stock if you’re down 5% to 7% on a recently initiated position, rather than hope and pray for a recovery.
Top stocks in high-growth sectors like technology and communication services have outperformed the second and third best stocks by wide margins, sometimes delivering total returns that exceed their nearest peers by 30% to 50% over key periods.
Psychologically, this can be very difficult, but you must train yourself to cut your losses and quickly sell underperforming stocks. Over time, by adopting this discipline, you’ll find yourself invested in the group leaders.
If you have a flower garden, you want to pick the weeds out of the garden and let the flowers grow, the same concept should be applied to your portfolio.
Rip the weeds (underperforming stock) out of your portfolio and water the flowers. (top performing stocks)
High RS names will lead you to success.
What Is Next
Overall, we do not yet see the irrational exuberance that typically precedes a major market top.
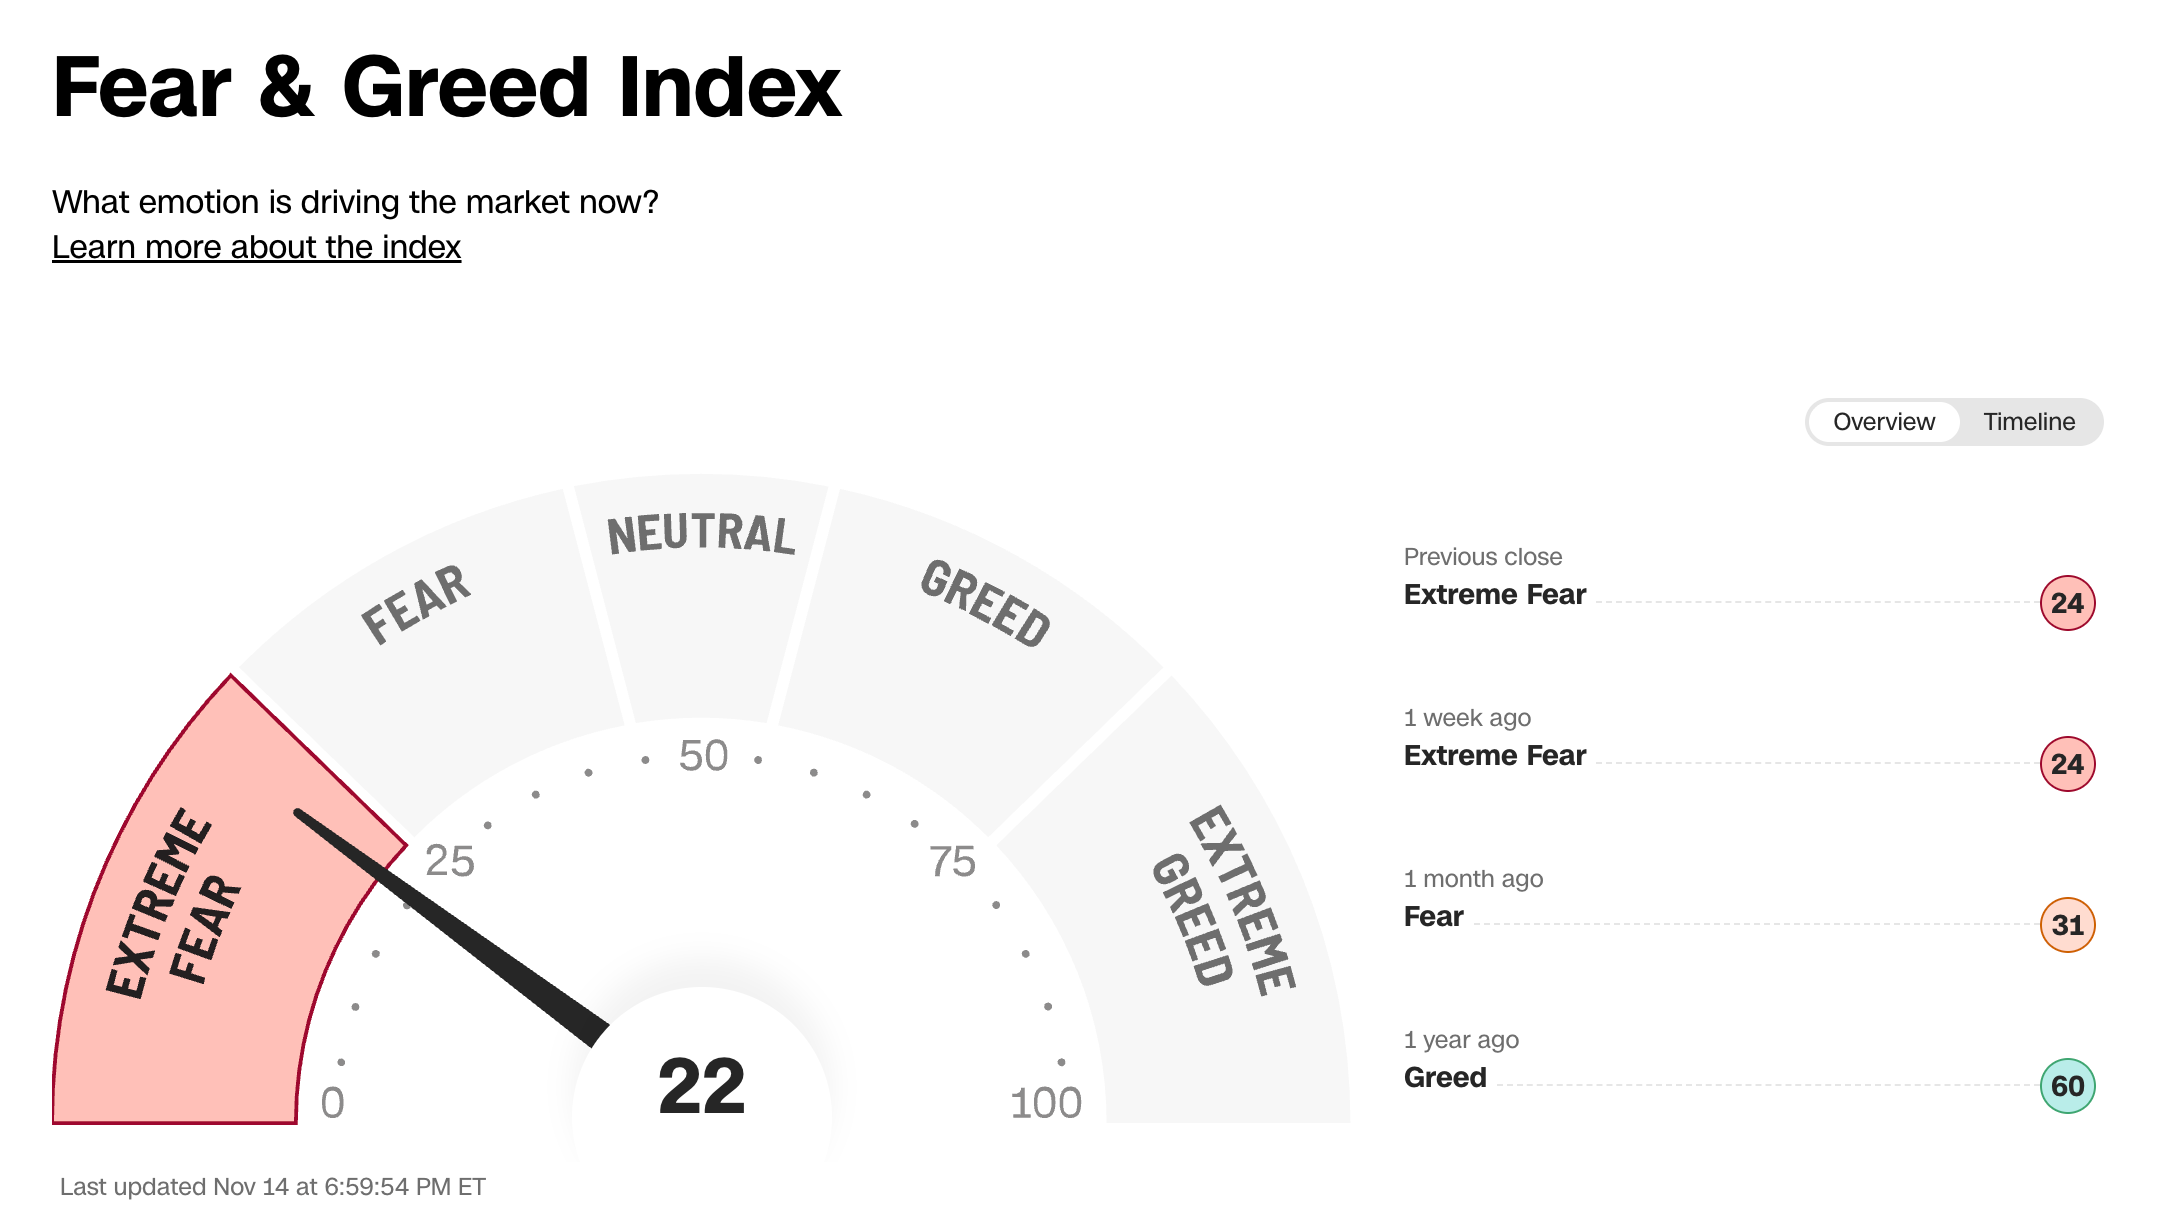
Major indexes are only a few percentage points from record highs and we have extreme levels of fear in the overall market.
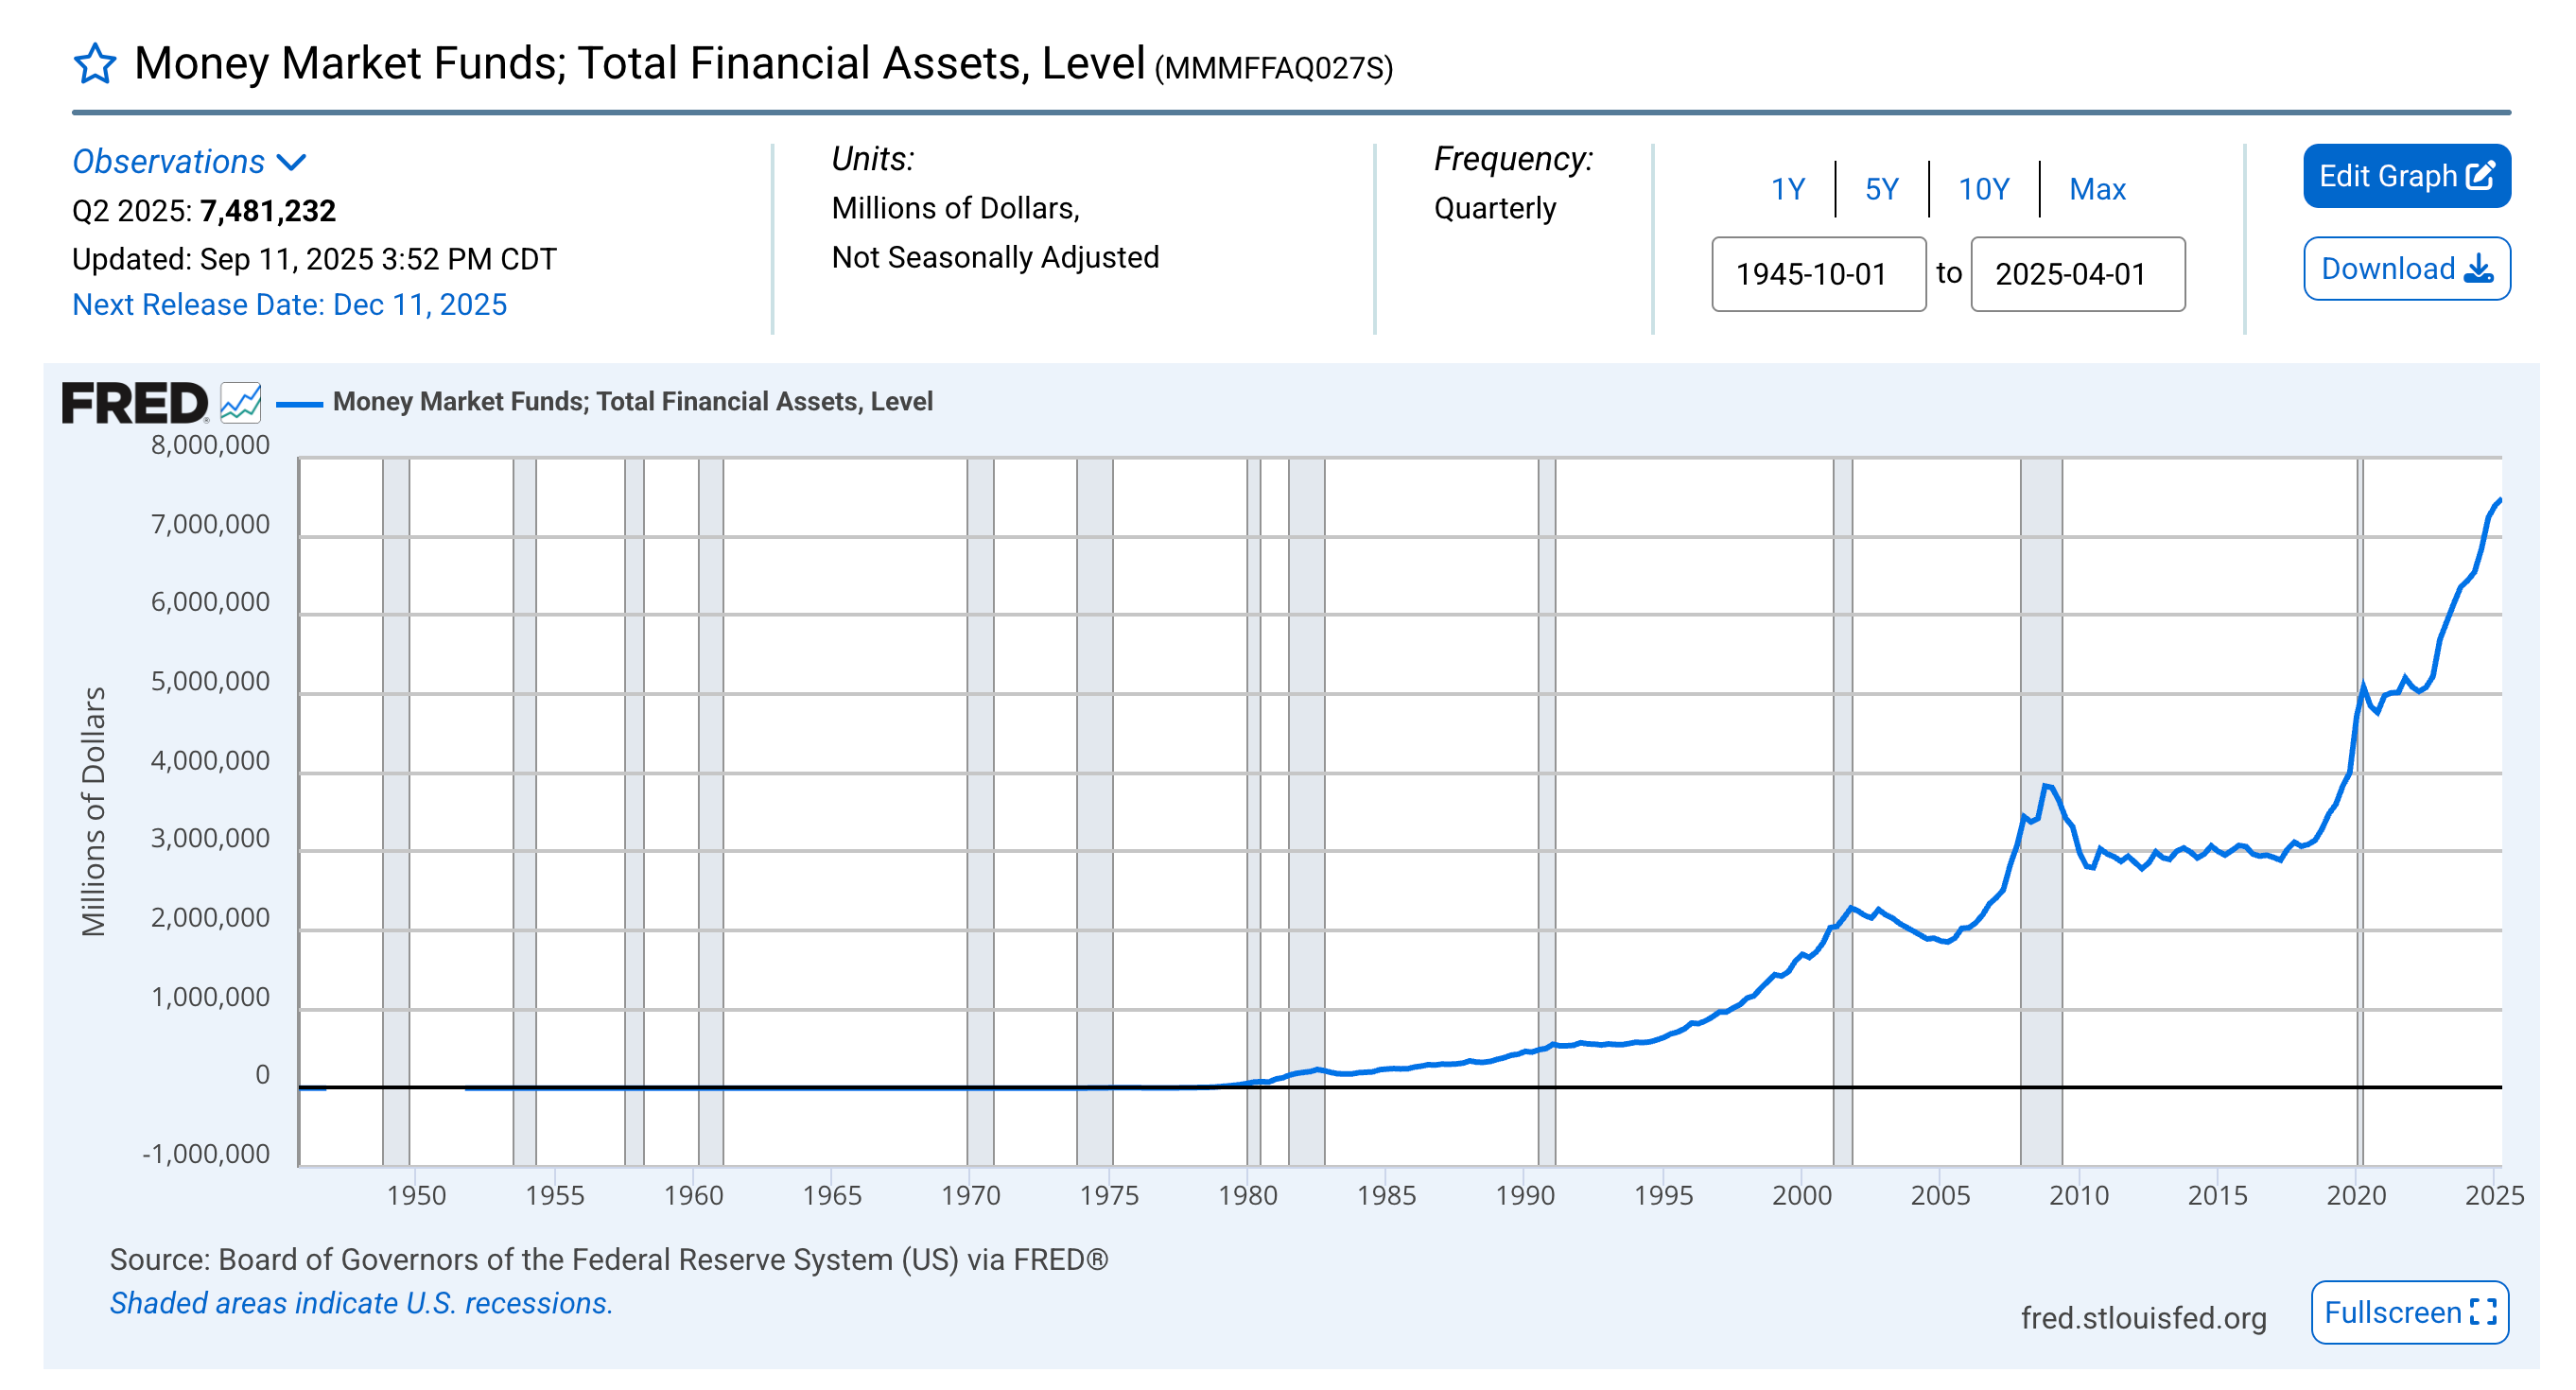
Additionally, we have over $7 trillion sitting in money market funds.
The IPO market in 2025 is just beginning to pick up momentum but remains well below the peak levels witnessed during prior major bubble tops like the dot com era.
Just before the 2000 dot com market top, IPO activity was remarkably high.
1999 saw 476 companies go public and in 2000, around 380 - many companies producing letting to no revenue or profit.
We believe we will see similar action at the top of the AI “bubble”, however we are not there yet.
We maintain the stance that the market is currently in a normal corrective phase, particularly when evaluating performance at the individual sector and stock levels.
Central Park Tower
Please enjoy this walk through of the duplex at Central Park Tower
Central Park Tower 127th and 128th floors:
Price: $128,000,000
11,535 ft² | $11,096 per ft²
18 rooms | 8 beds | 9.5 baths
For the full tour please check out the video on YouTube
Updates
The Behind The Street Newsletter will be published every other Thursday.
The Behind The Street Newsletter is for educational use only, not financial advice.
The newsletter will have a focus on financial markets, equities, fixed income, real estate and a market update section focusing on New York City & Miami real estate.
If yourself, a family member or friend is looking to buy, sell or rent anywhere in New York or Miami please contact me: Thomas.Malloy@corcoran.com
We also work with institutional clients looking for exposure to NYC and Miami.
Thanks for reading Behind The Street ! Subscribe for free to receive new posts and support my work.'