Powell Speaks - Yields Collapse: What This Means For Your Portfolio?
A Rumble in the Debt Market
FOMC
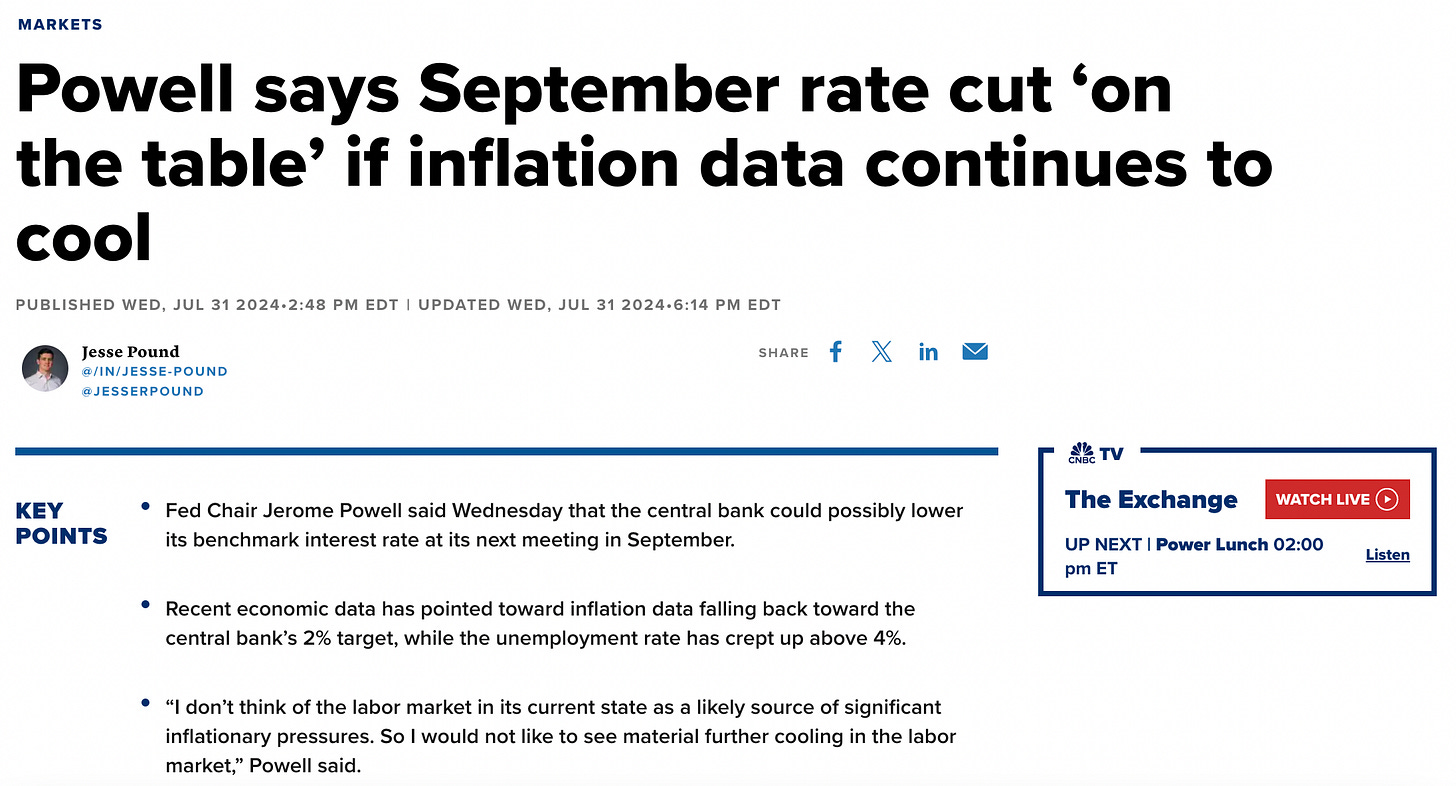
Federal Reserve Chairman Jerome Powell announced no change in the Fed Funds rate at the July 30 - 31 FOMC.
Fed Funds Rate: 5.25% - 5.50%
“If that test is met, a reduction in our policy rate could be on the table as soon as the next meeting in September,” - Jerome Powell
The dovish stance from Powell sent the bond market into overdrive, pricing in rate cuts at future meetings with yields declining across the curve.
Bonds
The US10-YR bond rallied sending the yield below 4% for the first time since February.
The long end of the curve also rallied, sending the yield on the US30-YR below 3.40%.
The market is fully expecting rate cuts at either the September 18 or November 7 meeting - there are three FOMC meetings left for 2024.
September 17/18
November 6/7
December 17/18
It seems as if the market is split, some participants think the Fed should hike, some think they should have cut months ago and others want Jerome Powell to sit tight.
The big question is: Does the market think the Fed is making a policy mistake by not cutting fast enough?
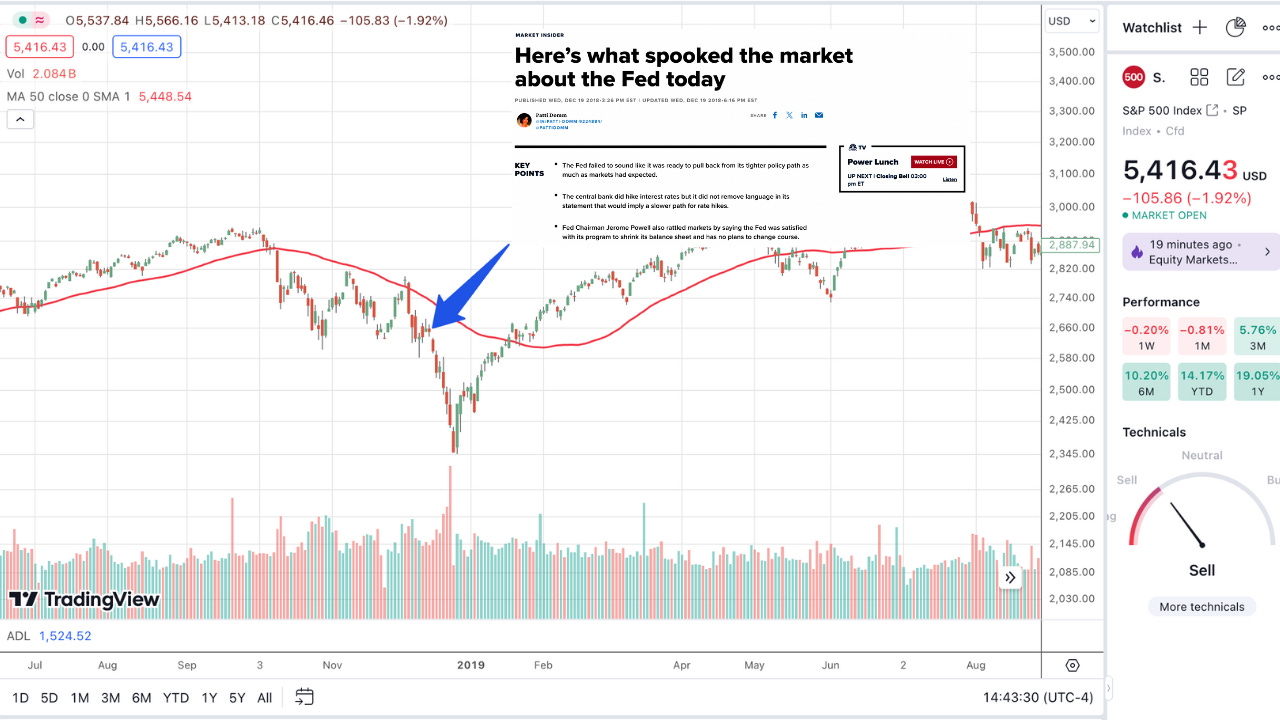
Merry Christmas (2018)
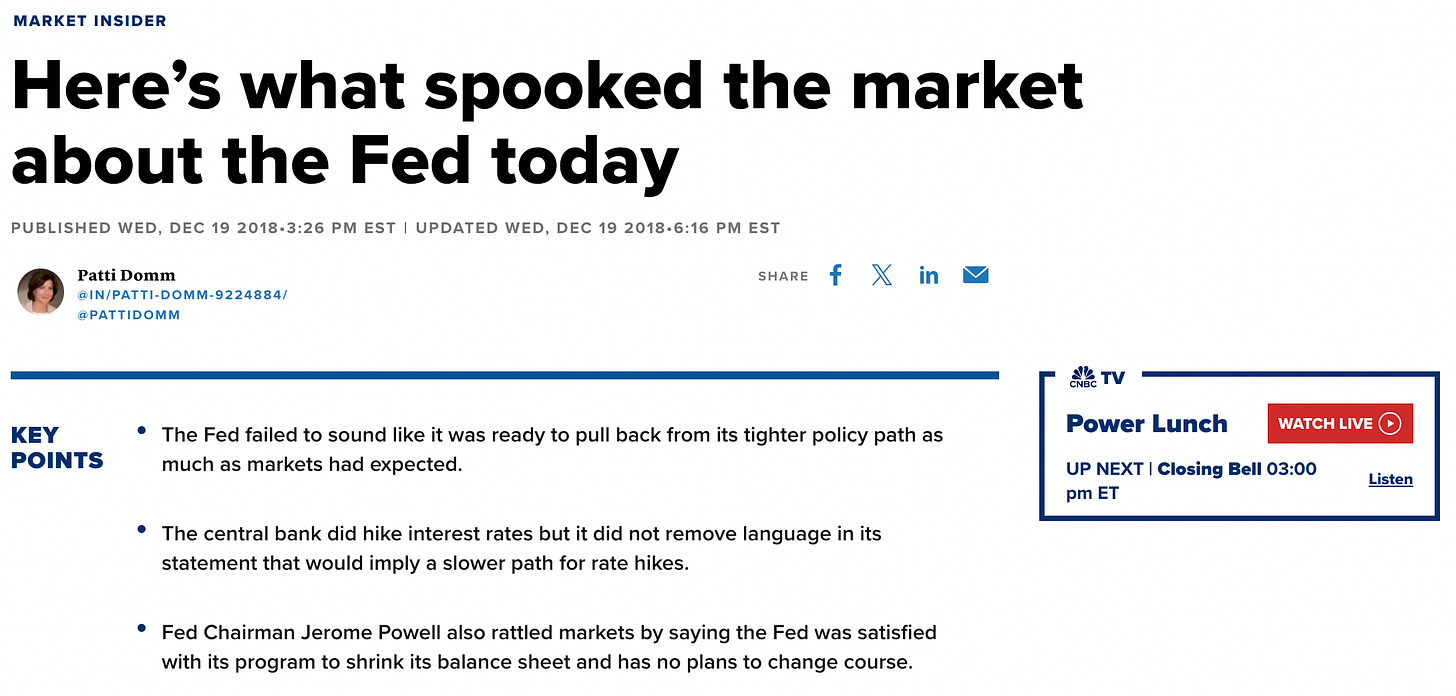
Twas a week before Christmas when Fed Chair Jerome Powell raised interest rates 25 basis points and came off more hawkish than the market had anticipated.
The talk on Wall Street was how the Federal Reserve was going to ‘over do it’ and tighten into a recession.
Pictured above is the Christmas crash of 2018, where the S&P 500 had a major waterfall style sell off with the market bottoming on Christmas Eve.
The general market threw a fit, seeing cash fly into the debt market and out of the stock market - the S&P 500 declined over 250 points or just under 10% in less than seven trading days.
We need to be prepared for every possible scenario regardless of our personal opinions of monetary policy.
In the last issue of Behind The Street titled “Welcome To Earnings Season - Volatility Incoming!” we spoke about the historical level of extension above the 50 day moving average across major indexes.
The stars have aligned for earnings season volatility.
A perceived policy mistake by the Federal Reserve gave Wall Street a very Blue, Blue, Blue Christmas in 2018.
Will another perceived policy mistake have Jerome Powell casting storm clouds over our final beach days of the summer'?
It is critical to stay disciplined and manage risk if you’re trading individual stocks.
If the leaders are falling under pressure, look out.
The Break Down
The S&P 500 is struggling to hold its 50 day moving average while selling off on relatively high volume.
The tech heavy NASDAQ 100 is sitting solidly below the 50 day moving average as tech stocks have been feeling the brunt of this sell off - particularly semiconductors.
The key to the market is semiconductors - the growth engine behind cloud computing, software and AI.
BlackRock iShares Semiconductor ETF SOXX 0.00%↑ has under cut its 50 day moving average on a heavy pick up in volume as leading semiconductor stocks get hit.
VIX is starting to ramp signaling fear, heading towards 20 - usually it is wise to short volatility on a major spike, we are getting close.
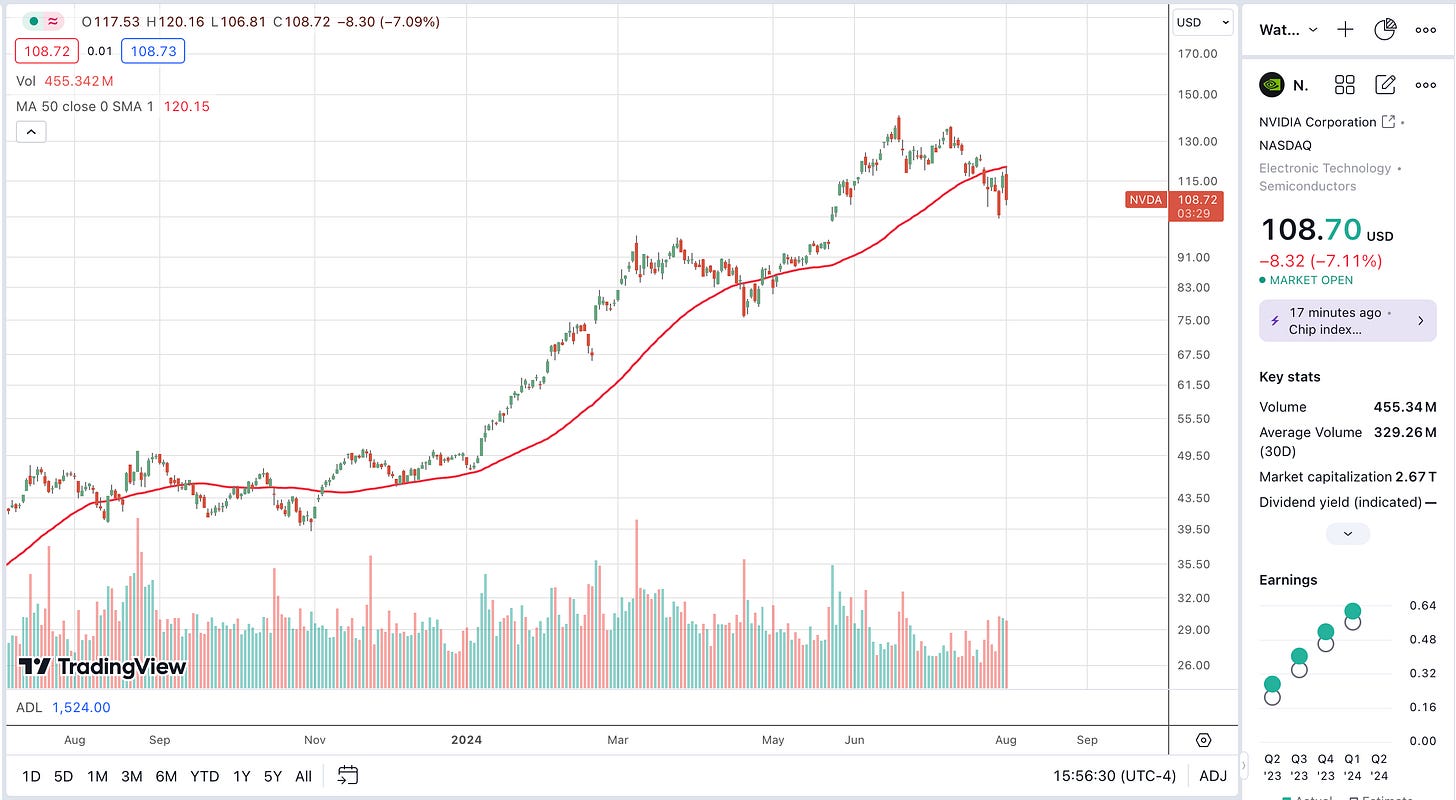
Market leaders such as NVDA 0.00%↑ are starting to roll over, breaking below the 50 day moving average on heavy volume.
Leading Stocks Below 50 Day Moving Average
Utilities XLU 0.00%↑ are outperforming amid a flight to safety trade and a rotation out of tech stocks - opportunities are coming.
When utilities start rocking, recession talk kicks in.
The market goes up and the market goes down, it is never a straight line in either direction.
After a powerful run, stocks have been extended going into earnings season with no shortage of things to worry about.
Assassination attempt on President Donald Trump
President Joe Biden dropping out
Wall Street accounting for a possible Kamala win ( tax policy )
War in the Middle East & Eastern Europe
Possible Fed Policy Error
We are in the camp that many are choosing to sell risk leading up to the U.S. Presidential Election and redeploy appropriately depending on result.
It’s the perfect culmination of catalysts for a pull back in the market that will present us with fantastic opportunities to buy great companies in Q4. ( In a perfect World )
S&P Market Performance- Election Years
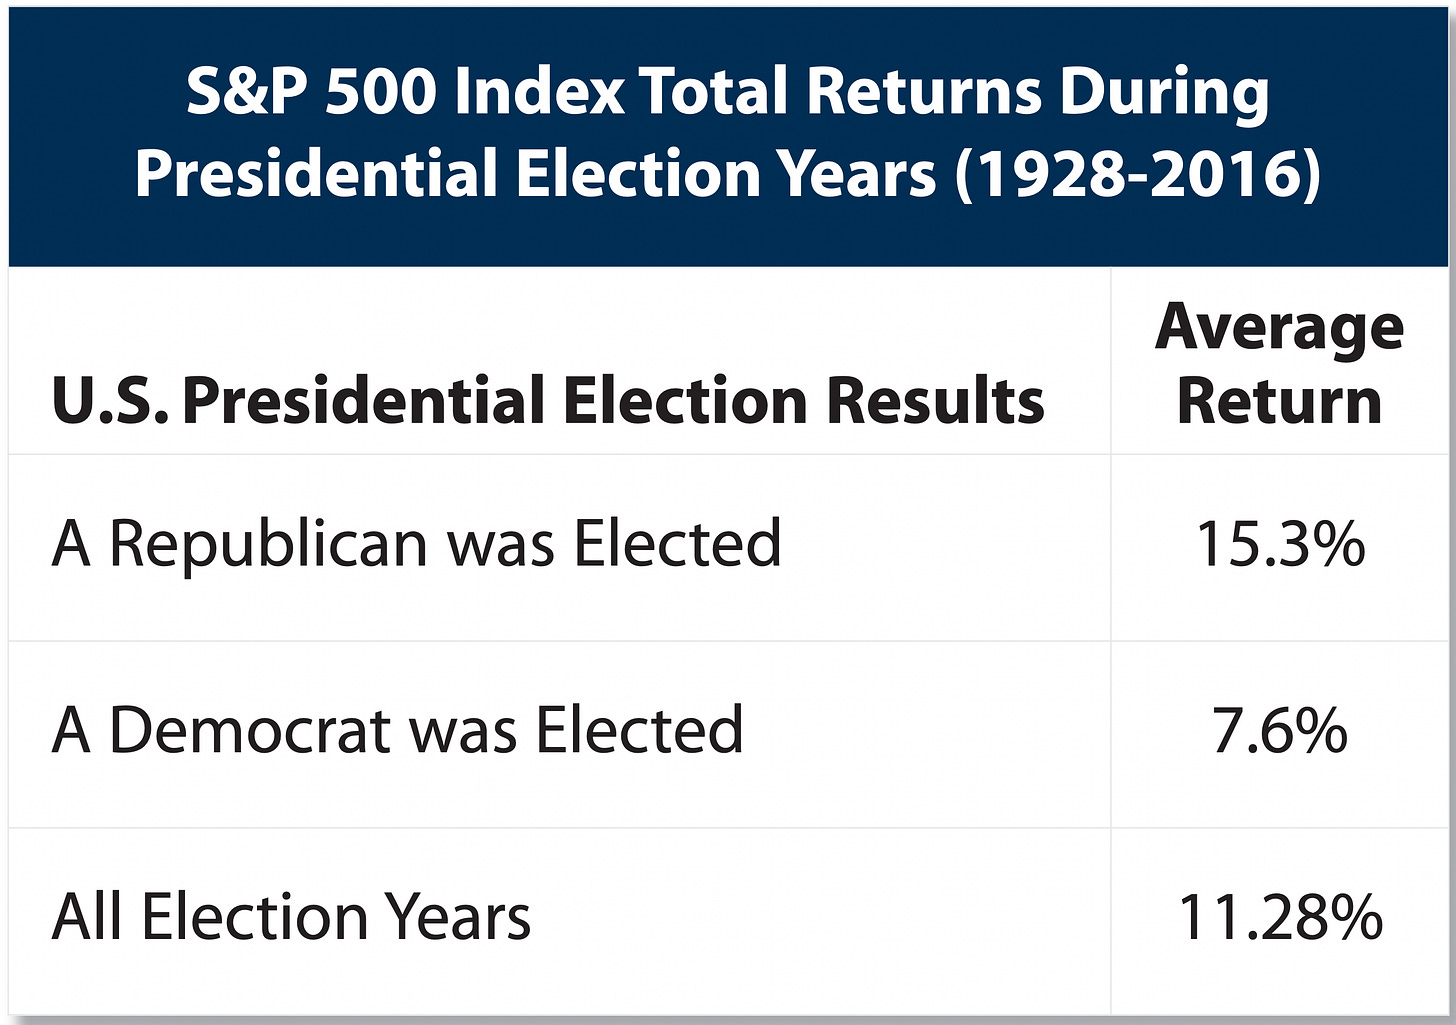
Data shows that S&P 500 returns are often muted in presidential election years with an average gain of 11% - Quite the contrast from last years 24%.
The year prior to an election year the S&P 500 on average returns 17%.
The question is, can we draw accurate conclusions from such a small data set?
There have only been 24 presidential elections since 1928.
A Few Interesting points to note according to First Trust Portfolios L.P.
When a Democrat was in office and a new Democrat was elected, the total return for the year averaged 11%
When a Democrat was in office and a Republican was elected, the total return for the year averaged 12.9%
Over 80% of election years provide positive returns for the S&P 500
Why are we talking about this again? Well, it’s important.
The political fear and rhetoric has reached an all time high in the United States, the above is a reminder that we have been though this before.
We go through this every four years and, over time, the American economy continues to outperform - this time should be no different.
Lower Rates - Cash Rotates
There are now 6.4 trillion dollars in cash sitting in money market accounts collecting 4.5% - 5% risk free.
Assuming a lower rate environment next year - a portion of that cash will likely come out of money market funds in search of higher yield in the market.
It is no guarantee that all of that cash will make its way into equities, but a portion of it certainly will.
Labor Market Weakness?
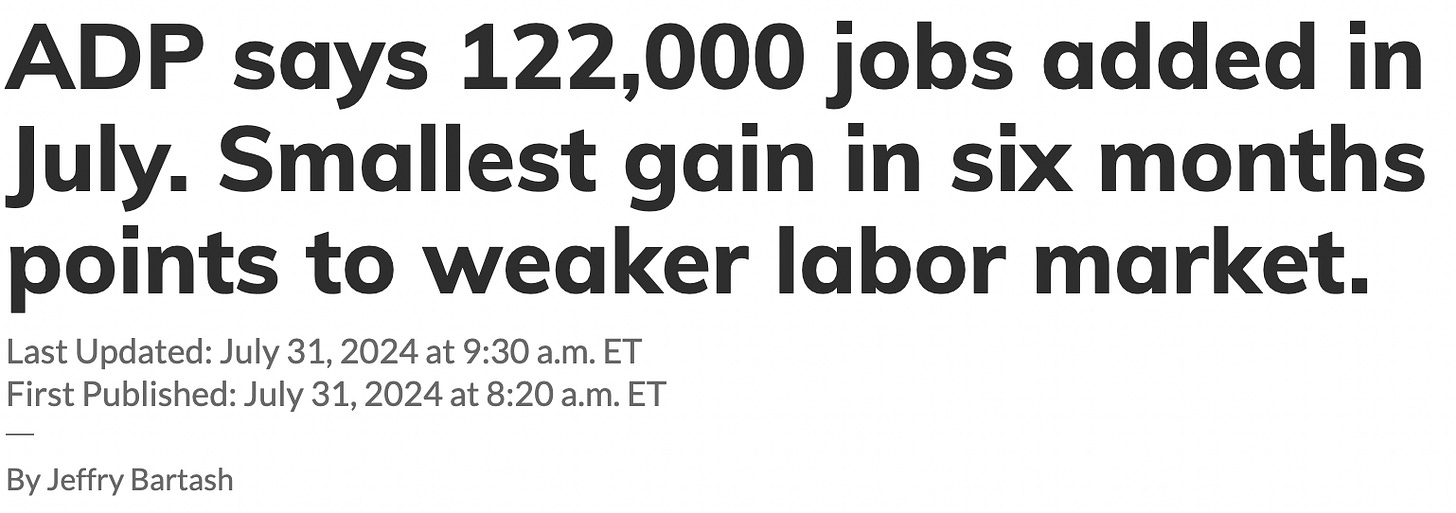
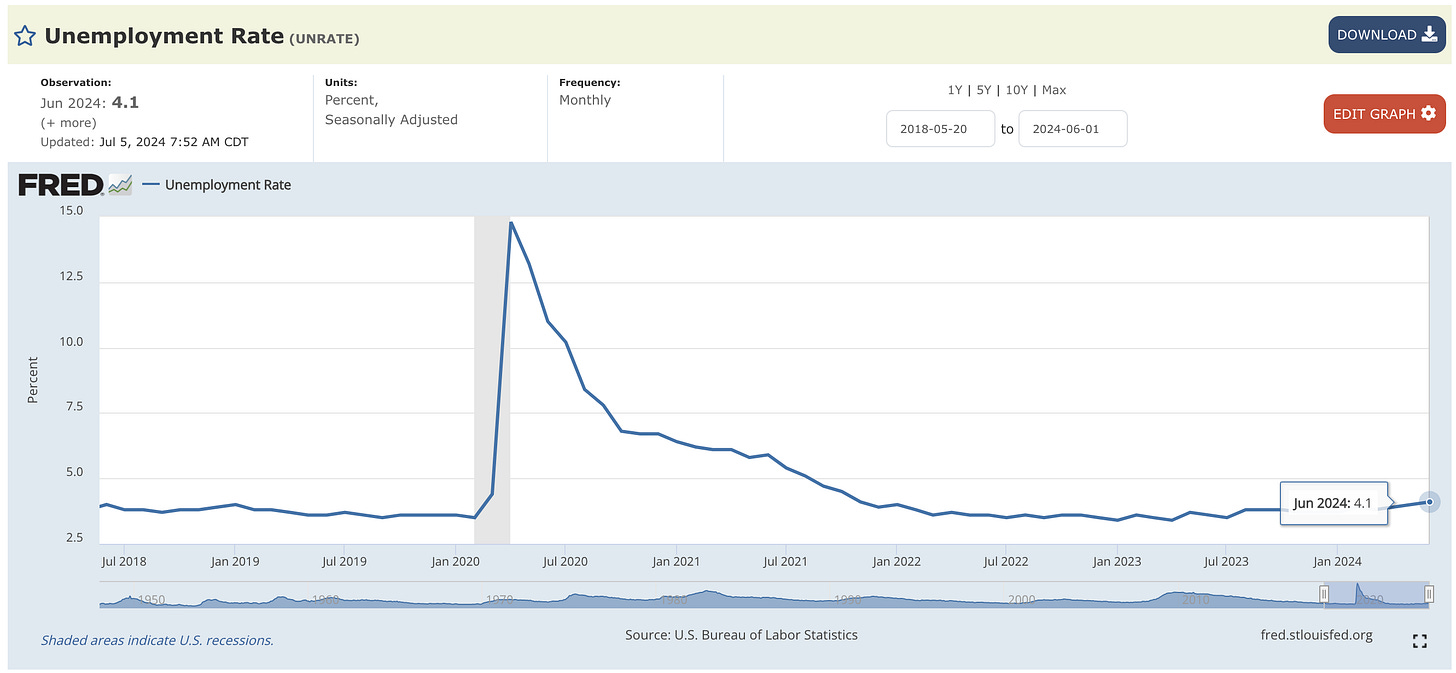
We are starting to see signs of a weakening labor market.
Unemployment has climbed up to 4.1% and weekly jobless claims increasing14,000 to 249,000.
August 2 we will get an update on the unemployment report as well as the updated unemployment rate.
In the next issue of Behind The Street - we will do a deep dive into big tech earnings and forecasts for 2025.
Updates
The Behind The Street Newsletter will be published every other Thursday.
The Behind The Street Newsletter is for educational use only, not financial advice.
The newsletter will have a focus on financial markets, equities, fixed income, real estate and a market update section focusing on New York City & Miami real estate.
I have joined the Kirsten Jordan Team at Douglas Elliman About Me Click Here
If yourself, a family member or friend is looking to buy, sell or rent anywhere in New York or Miami please contact me: Thomas.Malloy@elliman.com
We also work with institutional clients looking for exposure to NYC and Miami.
Thanks for reading Behind The Street ! Subscribe for free to receive new posts and support my work.











Thank you. Received notice by 4:03pm PT.