Flash Crash
In the last issue of Behind The Street we talked about the possibility of a market move reminiscent of the 2018 Fed policy error that led to a 250 point “waterfall” style sell off in the S&P 500.
A 10% move to the downside in less than seven trading days.
The only thing we were not expecting is to get that move 24 hours after our post - lets explore all of the key bottom signals we look for and identify opportunity.
READ HERE: Merry Christmas (2018)
The S&P 500 went through a two day flash crash with prices declining 330 points or just over 6% .
Along with the sell off came the most aggressive bearish sentiment we have ever experienced in over a decade of trading financial markets.
Now the question is: Have we bottomed?
3 Key Bottom indicators
In this section we will explore the key indications of a stock market bottom.
VIX Blow-Off
Extreme Bearish Sentiment
Put / Call Ratio
VIX Blow-Off
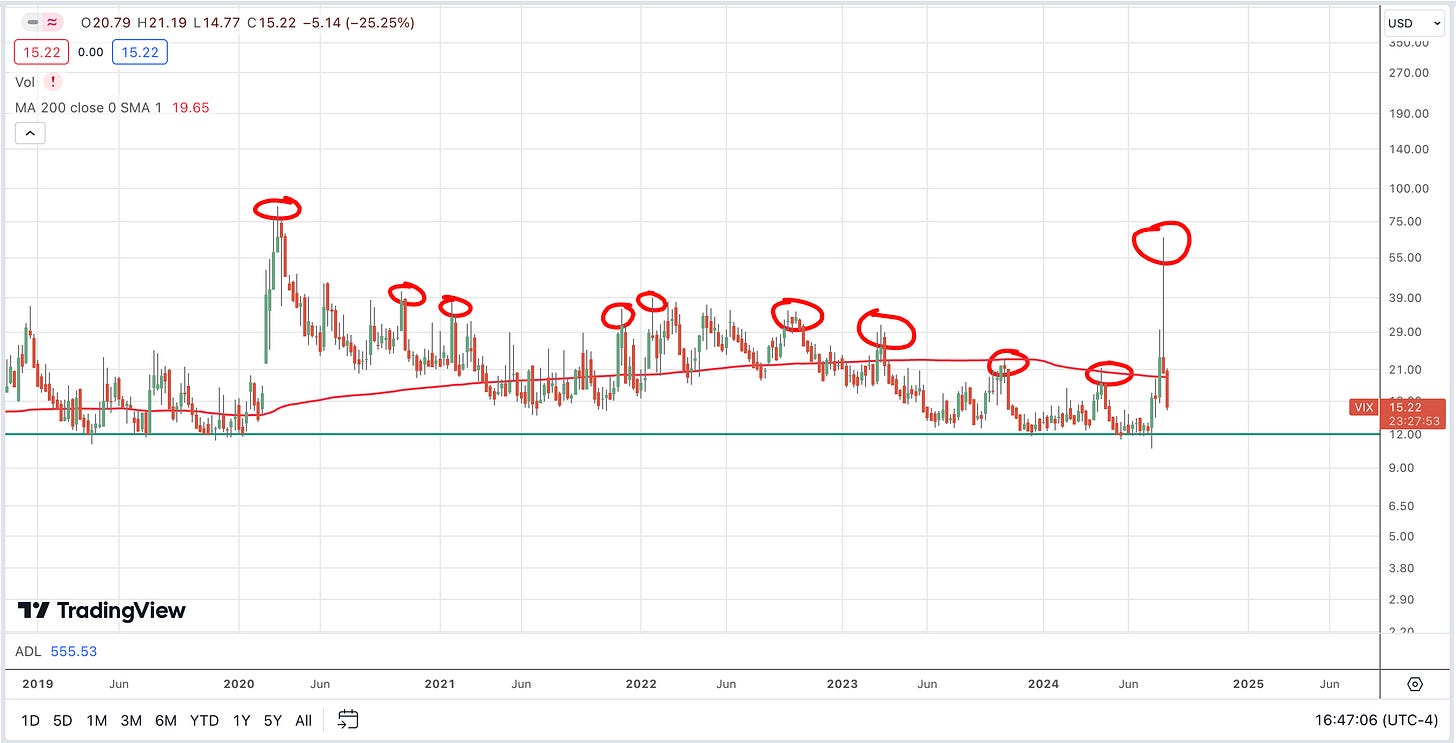
August 6, the VIX rallied to levels not seen since the 2020 COVID-19 pandemic, touching 66 intraday.
When we see an exacerbated move in the VIX to this extent - it is usually a good time to look for a market bottom and short volatility.
Traders can also look to put on shorter term trades as volatility is elevated making it easier capitalize on short term / day trading.
As the VIX returns to earth, you can look to extend your time horizon - adding to core positions in the portfolio for a long term hold.
VIX Blow-Off: Short term trading / day trading - capitalize on volatility.
VIX Crash: Look to size into core positions for longer duration hold.
Extreme Bearish Sentiment
We are sure you’ve noticed the extreme bearishness on the day of the flash crash sparked by the unwinding of the yen carry trade in Japan.
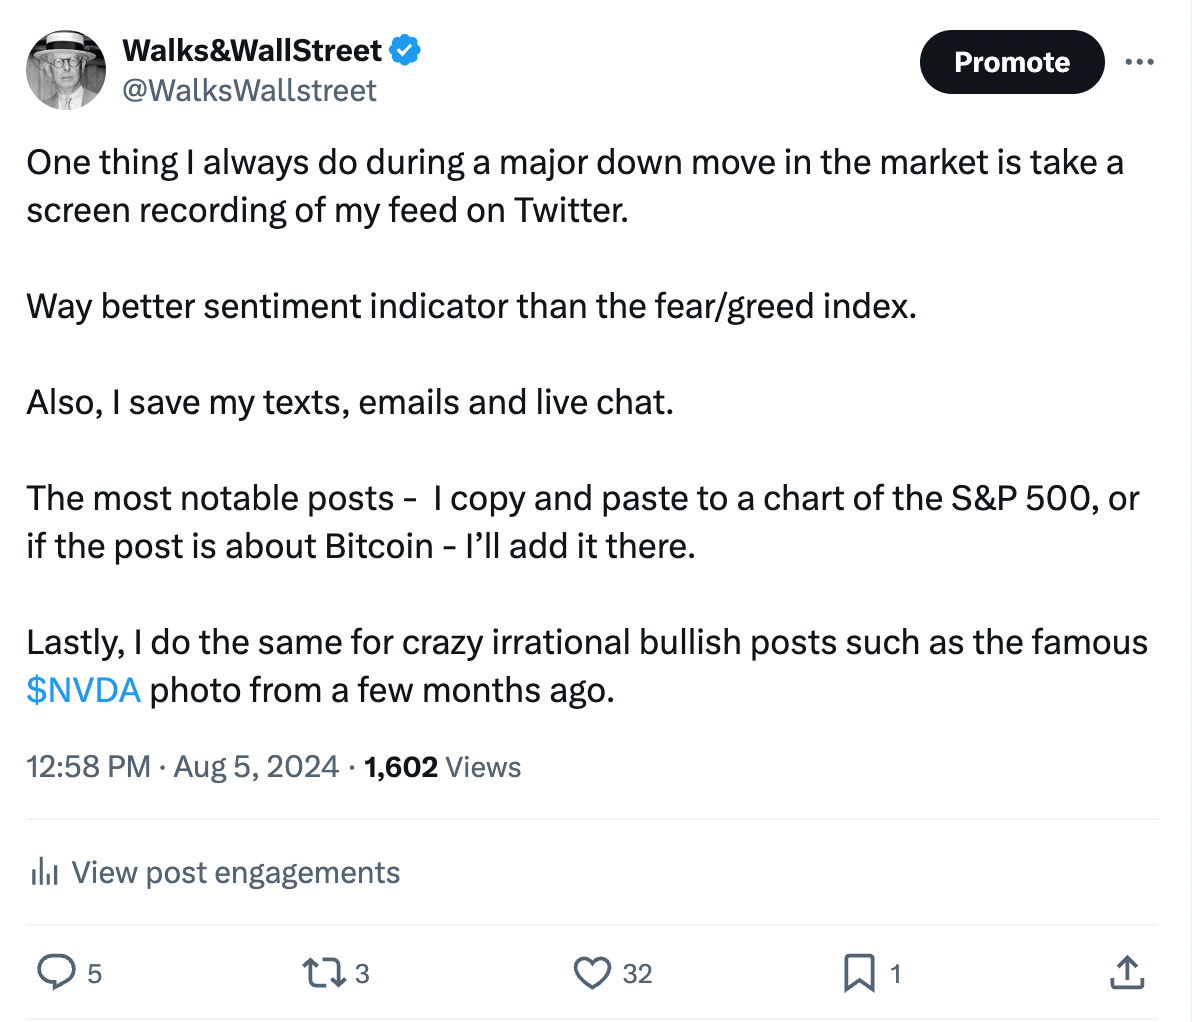
From our experience - sentiment was almost as extreme as the COVID-19 crash based on the emails, calls, DM’s and texts received during the sell off in addition to media headlines.
During a major move in the market, keep a mental note or a physical log of all of the major news headlines, texts from friends and family, emails from co-workers and most importantly - audit your personal feelings.
More often than not - the more over the top the negativity and the worse you feel - the closer you are to some sort of bottom in the market.
Put / Call Ratio
The Put / Call Ratio will give us an idea of how market participants are positioned - betting the market will fall - betting the market will rally.
Put Option: Gives an investor the right but not an obligation to sell 100 share of an underlying stock on a specific date at a specific price.
Call Option: Gives an investor the right but not an obligation to buy 100 shares of an underlying stock on a specific date at a specific price.
During the sell off we saw major put buying in the market - investors betting the market will continue to fall.
Note: Not all put buying is investors betting the market will decline, puts are also used to hedge a portfolio - thus the buyer may not have a one way directional bet that the market will decline.
It is quite interesting to see many traders buying puts when the VIX was near 60 - this makes buying puts extremely expensive due to elevated volatility.
Putting It All Together
Generally speaking, you want to see all three factors corroborating the trend.
Extreme fear regarding investor sentiment followed by a large spike in the VIX - coupled with an elevated put / call ratio.
Lastly, as the three indicators are corroborating - another good sign to look for is a substantial pick up in volume accompanying the sell off.
A large pick up in volume can signal a capitulation event where investors are being forced out of position to meet margin requirement or just being scared out of the market all together.
Volume profiles are much more visible on a weekly time frame - notice the highlighted volume spikes pictured above.
Most all are correlated with a major market bottom or intermediate term bottom.
Use the above to your advantage but also follow your sell rules and manage risk appropriately - the market is dynamic and subject to change on a daily basis.
The Break Down
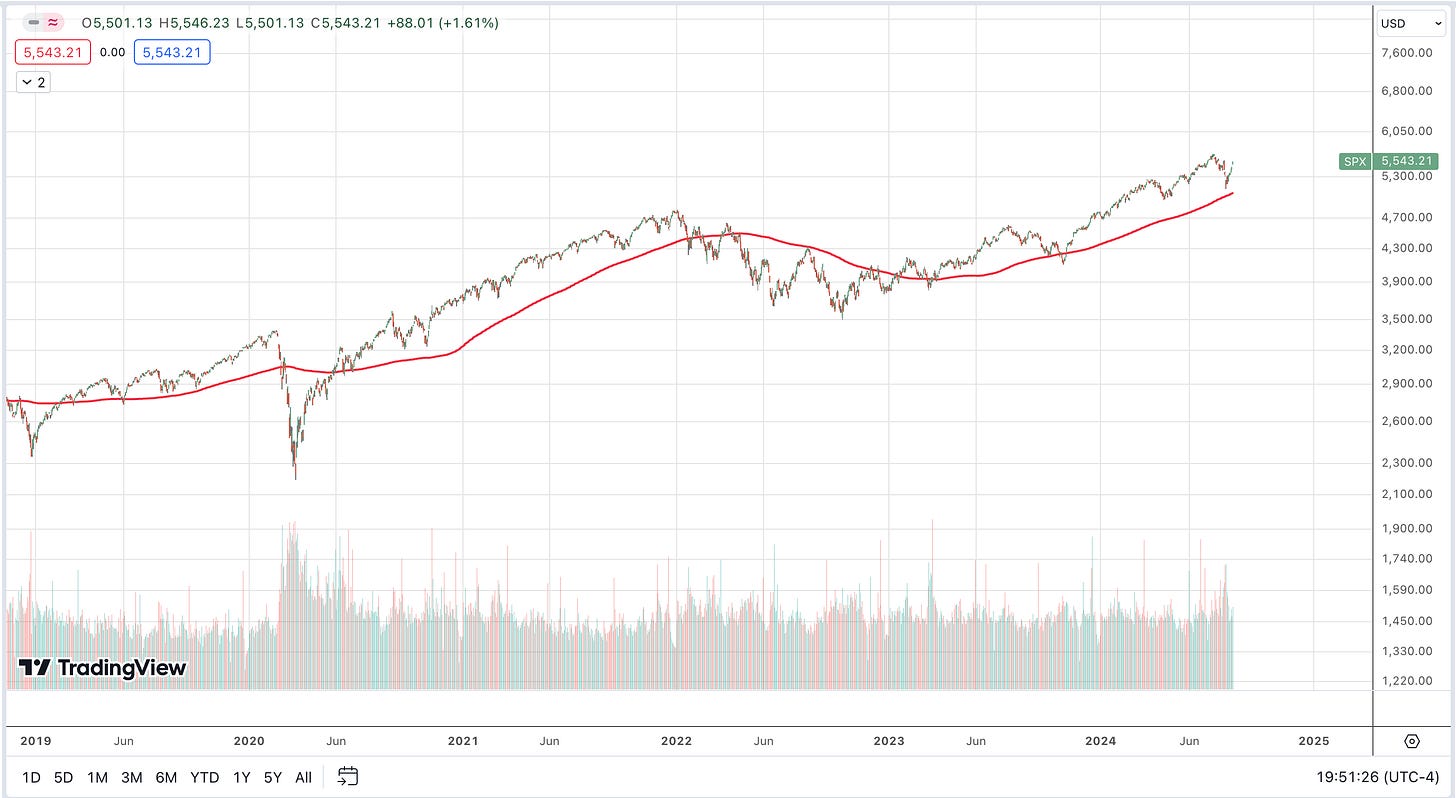
The S&P 500 and Nasdaq 100 appear to have made a normal correction to the 200 day moving average.
Major indexes tend to correct to the 200 day multiple times during a bull market cycle - this correction just happened faster than most expected.
Generally speaking, a strong rally from the 200 day is a sign the market is being supported and institutions are adding to positions.
When indexes are coming off correction - look to the individual stocks that have declined the least or even bucked the trend and went up as the general market sold off.
We are still months away from a U.S. Presidential election and we expect volatility leading up to the event.
Stay with the names that are trading above their 50 day and 200 day moving averages coming off solid earnings reports.
We Are Calling A Bottom!
You heard that right we are calling a bottom - but in luxury watches!
What? I thought this newsletter was about stocks?
It is but we can draw interesting conclusions from the luxury sector - specifically watches.
Check Out Watch Charts
Surprisingly there is an interesting correlation with luxury watches and general economic and market performance with a relative lag.
The S&P 500 topped in December 2021 while the Rolex index put in a top March 2022 and proceeded to decline from a high of 30,300 to 21,299.
There is currently a glut of supply on the market from individuals dumping luxury watches they overpaid for during the speculative blow off top in 2021.
2021 was also a record year for IPO activity on Wall Street = record bonuses for bankers = spending bonus money on watches at the top of the market.
As the IPO market shut down in 2022 - bonuses were lower and many people even sold watches on the secondary market.
Look, we know this is a small fractional example, but the general correlation stands - people purchase fancy things when they are making money hand over fist.
This could be a great opportunity to pick up a nice piece at a 25% - 50% discount and trade up in 2 - 3 years.
5 Beekman Street Penthouse
Take a look at our newest listing at 5 Beekman Street PH 51.
Listing Information: 5 Beekman Street #PH51 3 Bed 3.5 Bath 3,554SF
Updates
The Behind The Street Newsletter will be published every other Thursday.
The Behind The Street Newsletter is for educational use only, not financial advice.
The newsletter will have a focus on financial markets, equities, fixed income, real estate and a market update section focusing on New York City & Miami real estate.
I have joined the Kirsten Jordan Team at Douglas Elliman About Me Click Here
If yourself, a family member or friend is looking to buy, sell or rent anywhere in New York or Miami please contact me: Thomas.Malloy@elliman.com
We also work with institutional clients looking for exposure to NYC and Miami.
Thanks for reading Behind The Street ! Subscribe for free to receive new posts and support my work.


