Will The Market Crash Now?
The S&P 500 closed above 5,000 for the first time in history last week, prompting notable analysts and economists to heed warnings of a pending stock market crash.
The headlines are filled with dozens of articles calling for another 2008 style crash and even making comparisons of current market conditions to the historic 1929 stock market meltdown.
As the experts believe the stock market is nearing its finale crescendo, we believe this bull is just a baby starting to grow its horns.
The S&P 500 entered a bear market on June 13, 2022, the first close down 20% from the previous high.
When the market rallies past the first bear market close, it is said that we are in a new bull market.
The new bull rally may fail and cut back below the first bear close, if this happens we can measure from the next low back to the first bear close.
Note: There are different ways to measure a bear market and a new bull market. This is the method we follow.
EXAMPLE:
The S&P 500 entered a bear market on July 9, 2008 at the first close down 20% from the previous high.
December 20, 2010 was the first test of the bear market close - signaling the market had transitioned from bear to bull.
The first rally attempt went on to fail and under cut the bear low - but on January 10, 2012 we tested the first bear close, broke out, and the market went on to run 124% into the highs of 2018.
Historically when the market emerges from a severe bear market - on average, the market goes on to run 118% in the next cycle.
Currently the S&P 500 has rallied just 27% since the transition from bear to bull and just 5% from the break out into new high territory.
Note: the market is just emerging from a 105 week base with a peak to trough draw down of 27.57%.
A Look Under The Hood
The first stocks out of the gate and into new highs at the start of a new bull market are usually your true market leaders - and tend to go up more than the tier 2 and tier 3 stocks that are still well below pervious highs.
A Few Examples of TMLs :
NVIDIA NVDA 0.00%↑
Palo Alto Networks PANW 0.00%↑
Super Micro Computer SMCI 0.00%↑ ( Potential blow off top )
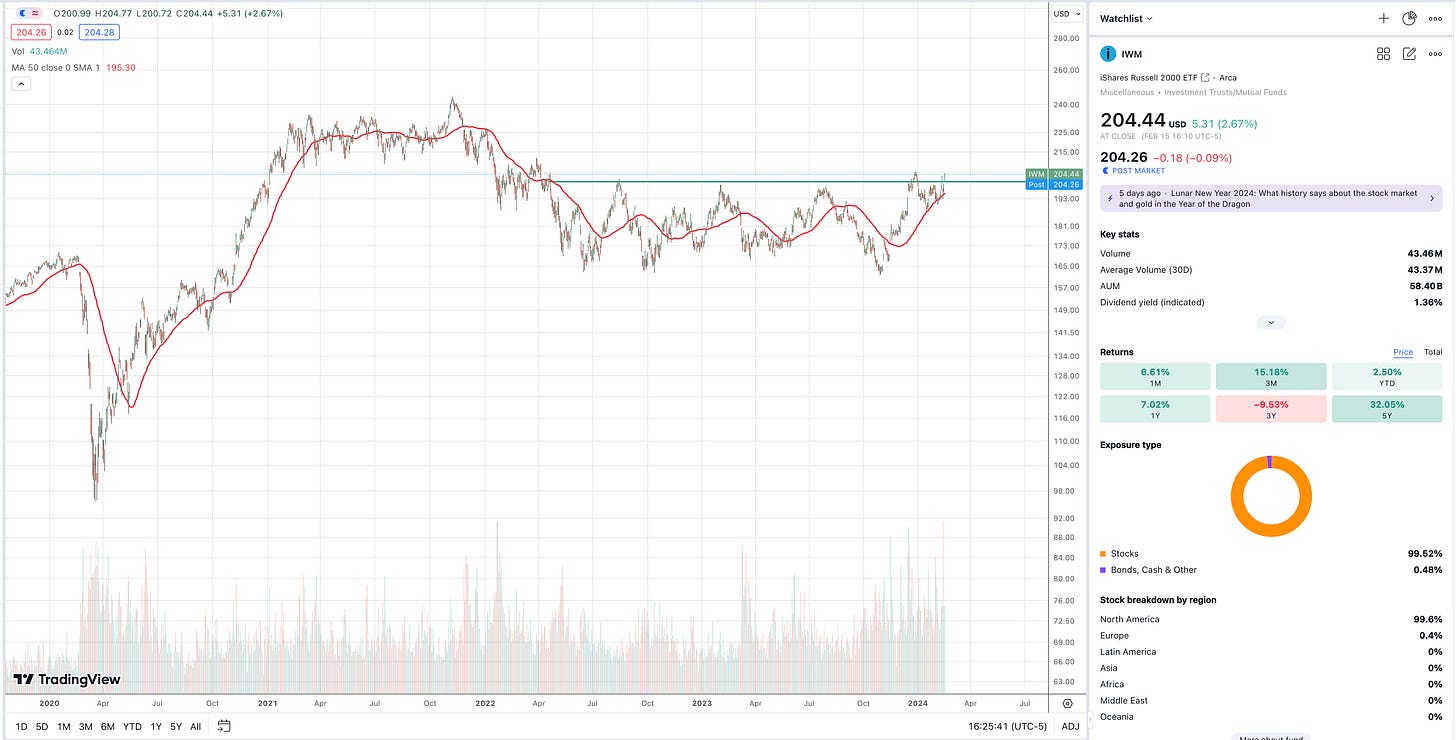
Small caps are starting to participate in the rally with the iShares Russell 2000 ETF IWM 0.00%↑ catching support at the 50 day and breaking out of a stage 1 base over $200.
Should the Russell 2000 continue its rally to test previous highs, that is additional evidence the rally is broadening out.
We want to see large caps pull back, money rotating into small caps and tier 2 / tier 3 stocks.
Microcap stocks are just starting to find their footing with the iShares Microcap ETF IWC 0.00%↑ trading back above the 50 day moving average, clearing a years worth of overhead price action.
Drilling down to specific sectors - a diverse range of sectors are now participating in this rally.
Homebuilders:
Continue to defy the many calls for another housing crash with the iShares U.S. Home Construction ETF ITB 0.00%↑ performing extremely well trading into new highs.
Semiconductors:
Breaking out of a cup with handle base into new record highs for the iShares Semiconductor ETF SOXX 0.00%↑
Biotechnology:
Biotech tends to have very drawn out and long 10 year consolidations before breaking out and running for several years.
The iShares Biotechnology ETF IBB 0.00%↑ is holding above the July 2015 swing high at $133.42 and its 50 day moving average.
Transports:
Dow Theory is a financial theory that says the market is in an upward trend if one of its averages (e.g., industrials or transportation) advances above a previous important high and is accompanied or followed by a similar advance in another average - investopedia
iShares U.S. Transportation ETF IYT 0.00%↑ just made a new closing high, the first new high since May 10, 2021.
iShares U.S. Transportation ETF Top Holdings:
Probably one of the most important and significant bullish signals in this market is the new emerging leadership in the transportation sector - this actions does not happen in bear markets!
U.S. Manufacturing - Improving
The manufacturing sector accounts for 20% of the U.S. Economy, making the ISM Manufacturing Report on Business an important leading economic indicator.
Both professional traders and portfolio managers as well as the Federal Reserve use the ISM PMI report to help make trading decisions and set monetary policy.
Economic activity in the manufacturing sector contracted in January for the 15th consecutive month - this may sound like bad news, however, this doesn’t tell us the full story.
We suggest going to the official website for the Institute For Supply Management and downloading all ISM PMI data since the 1950’s - export to excel and build a model that is updated each month with the new PMI data point.
This will allow you to see the business cycle in real time and draw correlations between PMI peaks and troughs with S&P 500 performance.
Below is a simple model we built showing the 12 month ISM PMI trend.
Note: It is the trajectory of the PMI numbers that matter most, not necessarily the number itself.
The Manufacturing ISM® Report On Business predicts U.S. GDP growth roughly 80% of the time, with 20% sending false readings.
Meaning the PMI numbers are heading in the same direction as U.S. GDP roughly 80% of the time.
As investors this is important leading economic data due to the fact that GDP growth is highly correlated with the S&P 500.
Back To Duration
The irrational exuberance that everyone is calling for is so far off into the future and there are a few reason why.
Bitcoin has yet to make a new high for the cycle:
Bitcoin recently crossed back above $52,000 and we believe the move is just getting started.
When markets are entering a climactic blow off top phase, you see all asset classes gunning into record high territory - often times gapping up consistently on the open.
The most speculative and “risk on” asset class of them all - Bitcoin, is still 33% shy from testing the previous record high.
Not to mention, total inflows into the new BlackRock Bitcoin ETF IBIT 0.00%↑ notched a half a billion just yesterday.
Stan Druckenmiller an American billionaire investor, philanthropist and former hedge fund manager talks about the possibility for AI to power this cyclical bull market for many years.
When you have a true market liquid leader that has the earnings power, the sales power, all the fundamental factors you want to see in a leader - you have to sit through earnings.
If you can find a stock and sit through 6 - 8 beat and raise earnings reports, that stock on average will go up over 150%.
Please read our recent newsletter talking about the potential power of AI: READ HERE
Inflation Update
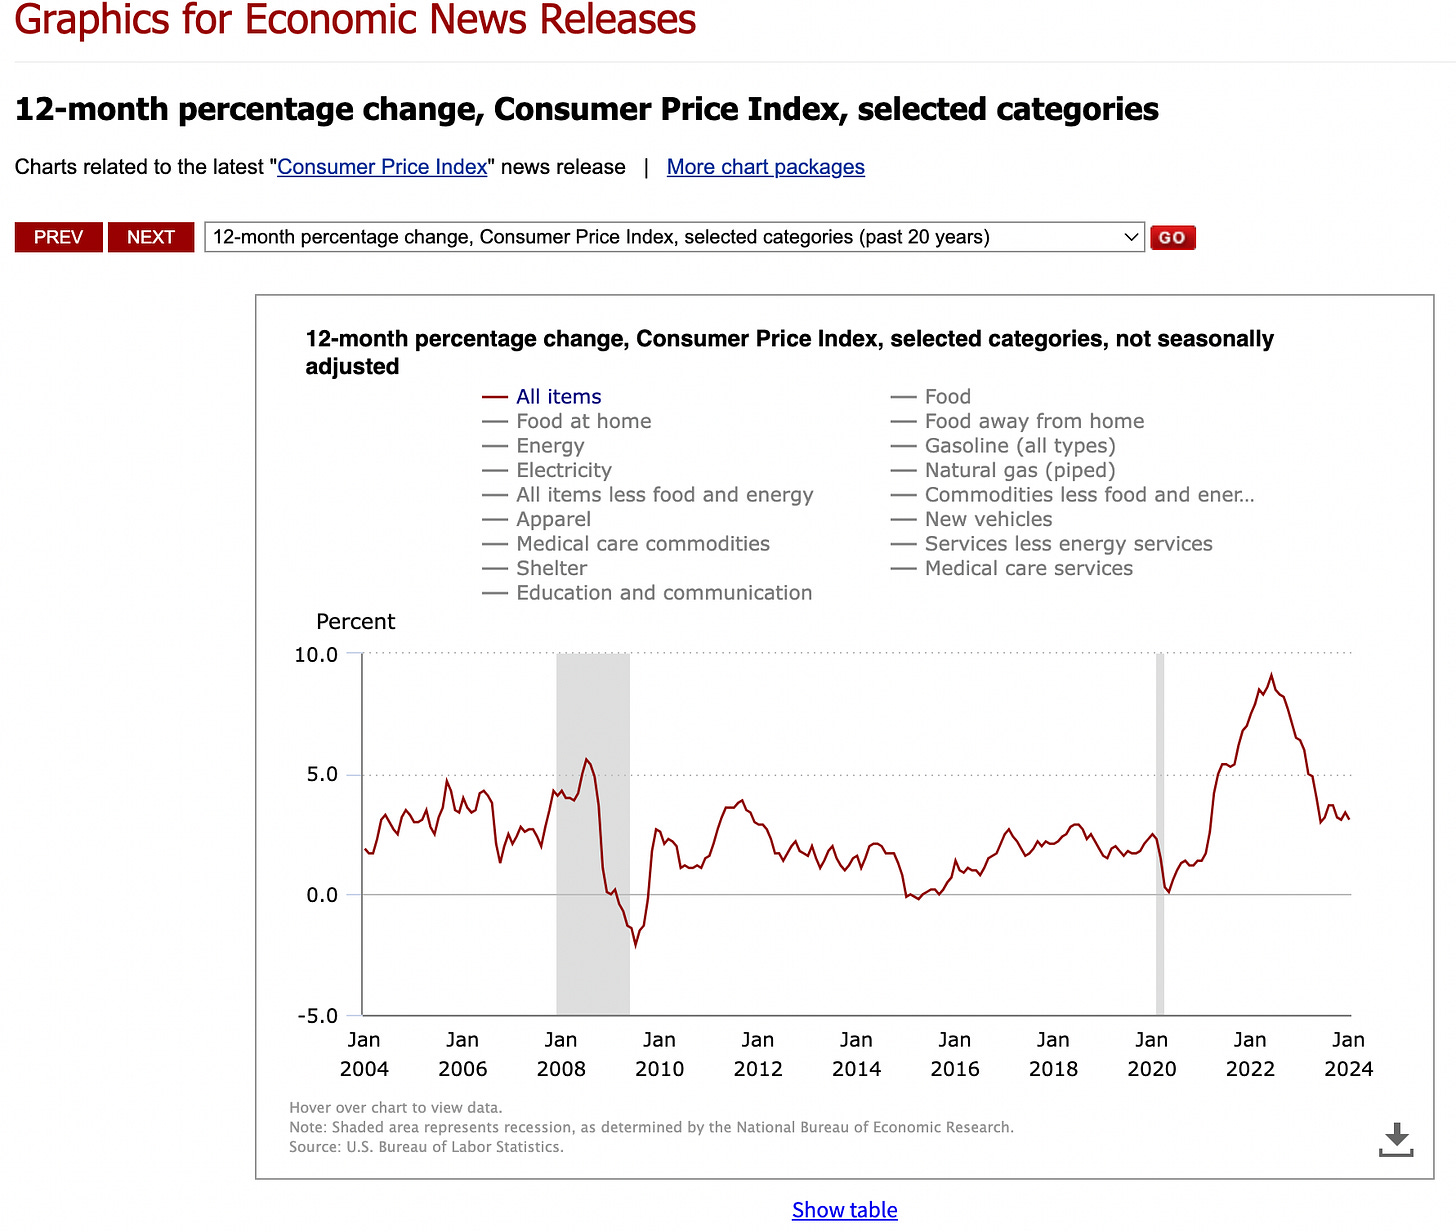
The Consumer Price Index for all Urban Consumers (CPI-U) increased 0.3% in January on a seasonally adjusted basis, after rising 0.2% in December - U.S. Bureau of Labor Statistics
Headline CPI: 3.1%
Core CPI: 3.9%
Much of the inflation issue can be attributed to shelter.
The index for shelter continued to rise in January, increasing 0.6% and contributing over two thirds of the monthly all items increase.
The good news is that shelter costs are coming down, it just takes longer being that asset prices tend to have a faster reaction to rising interest rates the more liquid they are.
Shelter = illiquid
The chart above depicts headline CPI and shelter - notice the lagging effect in shelter in relation to the headline number.
We are starting to see consistent year over year declines in the shelter as interest rate hikes start to make their way through the economy - impacting illiquid assets.
The shelter index in the Consumer Price Index (CPI) contributes to around one-third of the CPI calculation - the further shelter falls, the faster we get back to 2% inflation.
No Rush To Cut Rates
Fed Chair Jerome Powell should be in no rush to cut interest rates
Stock Markets at Record Highs
Unemployment at Record Lows
Inflation Over 3%
Housing Market Still competitive
Why stimulate and economy that seems to be firing on all cylinders?
Celebrate too early by cutting rates and the inflation genie may come out of the bottle for round two.
The market doesn’t necessarily need low interest rates - it just needs to know they are not going any higher.
We can adjust to higher for longer, and the market is telling us that a Fed Funds Rate at 5.25% - 5.50% is just fine.
Access the CME Fed Watch Tool: HERE
New York City Real Estate - Featured Listing
Welcome to La Botanica - a stunning triplex apartment in the heart of New York City’s East Village.
List Price: $4,595,000
4 Bed 4.5 Bath
3,052 SF
4 Private Outdoor Spaces
Updates
The Behind The Street Newsletter will be published every other Thursday.
The Behind The Street Newsletter is for educational use only, not financial advice.
The newsletter will have a focus on financial markets, equities, fixed income, real estate and a market update section focusing on New York City & Miami real estate.
I have joined the Kirsten Jordan Team at Douglas Elliman About Me Click Here
If yourself, a family member or friend is looking to buy, sell or rent anywhere in New York or Miami please contact me: Thomas.Malloy@elliman.com
We also work with institutional clients looking for exposure to NYC and Miami.


Beautiful place love that so much ty for the tour. Loved the newsletter very informative ty
Thanks Tom, for the insightful article. In sales, I see widespread uncertainty, driven by politics and wage concerns, especially in sectors directly serving end consumers, like food, clothing, and medicine—crucial for the economy