Feb 24, 2022
No Need To Catch A Falling Knife
The S&P 500, Dow Jones Industrial Average, and NASDAQ continue their declines, but opportunity is just around the corner.
The good news is that there is no need for guess work, we can just sit back and wait for a Follow-Through-Day.
Markets tend to surprise to the upside and surprise to the downside and remain irrational longer than you can stay solvent.
It is important to protect your capital and manage risk so you can live to invest another day.
S&P 500 Rejecting The 50-Day Moving Average
The major moving averages are all rolling over and trending lower. Notice how the 50 - Day Moving Average rejects price, leading the S&P 500 lower. (Photo Above)
NASDAQ Composite Weekly Time Frame. 50 - Week Moving Average Leading Price Lower.
The NASDAQ Composite is getting hit harder as the market assigns more reasonable multiples to high growth tech companies as interest rates tick higher.
Notice the 50 - Week Moving Average roll over and reject the most recent price rally in the photo above.
The first major support on the NASDAQ Composite stands around the 12,000 level. If that level is breached we can look to the 9,800 level, or the high before the COVID crash of 2020. (02/19/2020)
How To Identify A Follow-Through-Day
Not all Follow-Through-Days will work, but no new bull market has ever started without a Follow-Through-Day.
During a market correction the major indexes will often make rally attempts off of the lows.
4 days after a rally attempt, if a major index closes 1.25% higher than the previous day’s close on thunderous volume, you have yourself a Follow-Through-Day.
This is a sign that large institutional investors are starting to buy back into the market and “test the waters”
The most reliable Follow-Through-Days occur on Day 4 through Day 7 of an attempted rally.
Thunder volume is a MUST in order to drive stocks higher, watch price action along with volume for best results.
Watch Investors Business Daily's Alissa Coram explain in detail how to identify a Follow-Through-Day
Building A Watch List
Not all stocks are buyable after a Follow-Through-Day.
Investors should focus on the very best stocks in leading industry groups with the highest relative strength lines.
Here are some things to look for when trying to identify stocks to buy after a Follow-Through-Day.
1) Relative Strength (RS) - compare the price performance over the last 52 weeks to other stocks on the market. This will help you identify top performing stocks that have held up better during the downtrend.
2) EPS Growth Rate - Try to identify stocks with an EPS growth rate of at least 20%
3) Revenue Growth - At least 25%+ revenue growth the previous two quarters.
4) Forward Guidance Positive - Look for a stock coming off an earnings report where management has beat analysts expectations and raised forward guidance on revenue and earnings forecasts.
Stocks that sell off the hardest during a downtrend tend to stay down and may never see their previous record highs again.
The stocks that are “fighting the trend” and holding up well during downtrends often emerge as the next true market leaders (TMLs) during the next bull cycle.
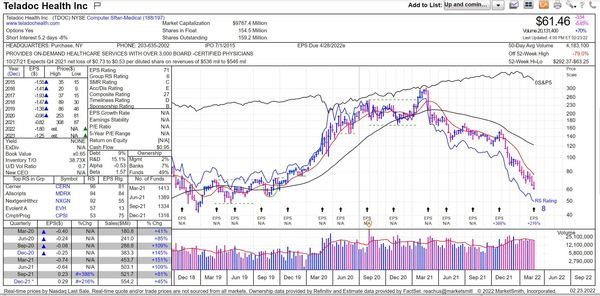
$TDOC sold off harder than most stocks. Notice Earnings box on the left.
Teladoc Health $TDOC, is now down 80% from its record high set back on February 16, 2021.
The market tends to offload low quality stocks with no earnings during downtrends, especially in an environment where interest rates are rising.
Look at the left side of the chart pictured above, notice that the earnings block is negative across the board excluding its most recent two quarters.
Now take a look at Alphabet $GOOGL, the stock is off 15% from record highs, holding up much better than the speculative high growth stocks with no earnings.
Watch the stocks that are selling off less in a downtrend and notice the characteristics about them, what is the differentiating factor?
The differentiating factor tends to be earnings growth, revenue growth, return on equity, and gross margins.
EARNINGS MATTER!
Especially in a downtrend. If you own a stock with no earnings during a correction, expect to get your face ripped off.
Gold - $GLD
The price action in Gold has me paying attention.
Peter Schiff must be happy!
I have never seen a chart like this ever in my life, $GLD is building a twelve year base and appears to be forming a handle.
If we break out to new record highs in Gold I will be forced to buy a position.
I will be long Gold over a new high.
Massive 12 year base forming on Gold. I will buy the break out IF it breaks out.
Growth stocks hammered, Gold ramping, rates rising, and sentiment bearish.
It is hard to be bullish considering the circumstances but be ready, be ready for the trend to change and turn up.
When we have the next Follow-Through-Day you will not want to buy stock. Stick to the rules and slowly gain exposure and let the market pull you back in.
There will be another uptrend.
Tesla - $TSLA / Apple $AAPL
Apple and Tesla are crucial for the health of the overall market.
If $AAPL breaks, the indexes will cascade lower.
Institutions tend to “hide out” in stocks like $AAPL during a down trend just so they can remain invested, but this does not mean we can’t see significant downside.
200 - Day Moving average sits at $151.00
If $AAPL breaks below its 200 - Day Moving Average at $151, expect the S&P 500 and NASDAQ to crack and crack hard.
It is usually the premium merchandise that sells off last and I believe we are near the end of the growth stock punishment.
$TSLA broke it's 200 - Day Moving Average on heavy volume today. Not good.
$TSLA broke it’s 200 - Day Moving Average today in heavy volume and $APPL will probably follow Tesla’s lead.
$TSLA now makes up almost 2% of the weighting in the S&P 500 with $APPL over 7%. When these two stocks move, so does the market!
Components of the S&P 500 www.slickcharts.com
Earnings Reactions - $HD
Home Depot reported earnings on Tuesday with EPS coming in at $3.21 vs $3.18 as expected by analysts. Revenue also beat expectations posting $35.72 billion vs the $34.87 billion expected by analysts.
Home Depot’s average ticket size increased to $85.11 compared to $75.69 a year ago.
When we do a little more digging we find something interesting. The reason average ticket size increased was not due to increasing demand, but due to inflation.
Consumers seem to be spending more not because they want to, but because they have to.
This could be a major reason why the stock sold off, yes the report was fantastic, but how long will the average consumer be able to put with consistent price increases?
At some point consumers will reduce spending to offset the increase in prices.
$HD Hammered After ER
Home Depots outlook was conservative with sales expected to increase 2.5% while EPS increases 4.7% for the full year.
$HD has a P/E of 20 and I wouldn’t be surprised to see it’s P/E fall back into the teens.
Lastly, Home Depot will now have a new CEO, Ted Decker come March 1. Ted will replace Craig Menear who will continue to serve as chair of the board.
Chinese Commercial Paper Market
I know I wrote about this in previous newsletters but I just cannot get my head around this.
The Chinese commercial paper market is imploding and no one is talking about it.
Could this be the reason why Gold is ripping?
Break of COVID 2020 Lows
In March of 2020 the global commercial paper market came to a grinding halt.
We have now broken the 2020 pandemic lows in the Chinese market, so what does that say about the Chinese commercial paper market now?
I am not one to call out a black swan event but this could be it. I don’t understand it.
$ARKK - Cathie Wood
I want to start off by saying that CathieWood research it top notch. I have so much admiration and respect for Cathie and her company.
But every bull market has its “rock star” and this bull cycle was Kathy Wood.
The amount of emails, texts, and tweets I got from friends and family last year asking me if they should buy the $ARKK funds was almost overwhelming.
MASSIVE RED FLAG
Many of the people asking about these funds couldn’t name five stocks in the ETF and didn’t know, nor cared, that almost every stock in the fund was trading at nose bleed valuations.
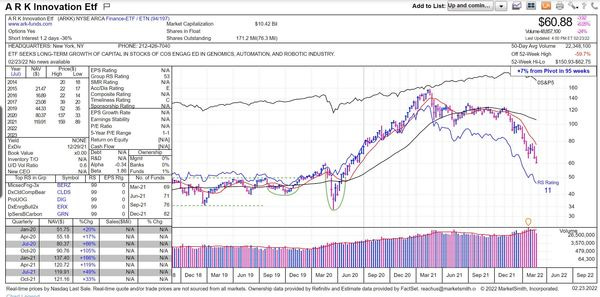
As interest rates tick higher these unprofitable growth companies continue to get pounded into the dirt, $ARKK is down 63%.
$ARKK Down 63% From Record Highs
Psychology is a major part of trading and investing and you must try to keep your head on strait and block out the noise.
Retail traders from South Korea on Reddit during the peak of the 2021 bull market were calling Cathie Wood “Money Tree”
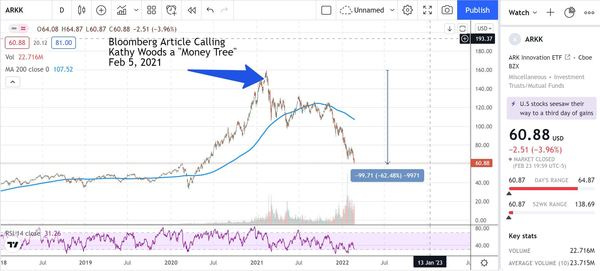
Bloomberg Article February 5, 2021 Calling Cathie Wood a "Money Tree"
Here is a major headline on Bloomberg calling Cathie Wood a “Money Tree”.
ARTICLE HERE: Cathie Wood Amasses $50 Billion and a New Nickname: ‘Money Tree’ - Bloomberg
What is interesting about this article is that it was published on February 5, 2021.
$ARKK ETF Top After Bloomberg Article
The $ARKK Fund topped six trading days after the article was published on February 16, 2021 and went on to free fall 63%.
The point is, you want to be selling into euphoria and always keep your head.
Don’t buy stocks just because you got a tip from some random person on Reddit that claims they are making money, they’re not.
What’s hot today will be cold tomorrow, don’t fall for the “flavor of the month”, follow the trend and listen to the market.
Over the long run Cathie will probably be right with many of her picks, but many of these stocks will go to zero.
The purpose of pointing this out is for educational purposes and not to point the finger at Cathie Wood.
She is an incredibly successful and smart woman that is a pioneer on Wall Street.
More Funds Will Blow up
There are other funds similar to Cathie Wood’s that are not ETFs but Hedge Funds / Mutual Funds that are massively levered up and are facing massive redemptions.
When the market turns on you so do your investors!
When prices decline Hedge Fund investors try to pull their money out to save whatever they have left.
Many are getting margin calls putting additional pressure on stocks driving them lower.
Flexibility
It’s important to be flexible and let the market tell us what it wants to do.
What if value outperforms growth for the next 5 years?
Will you be ready to trade with that trend and leave your ego behind?
Don’t be afraid to say to yourself “It’s possible that the only reason I’ve made money in the stock market is because I was LUCKY!.”
I always try to leave my ego behind and be open to anything and everything.
The trend is your friend.
Conclusion - Homework
Homework time!
I want to leave you off with one of my favorite interviews of all time.
Stanley Druckenmiller & Paul Tudor Jones are two of the greatest investors of all time.
Check out this conversation and enjoy.
Stanley Druckenmiller & Paul Tudor Jones Interview Robin Hood Conference (2016)
Welcome to all of our new Behind The Street readers!
Thank You


