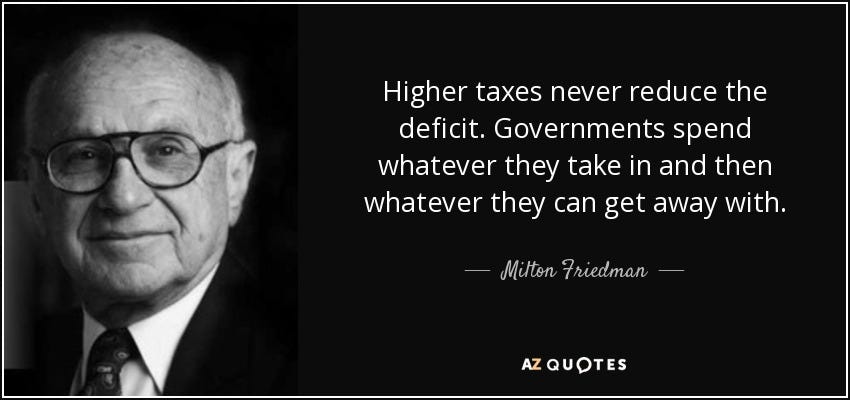
According to fiscal data at the U.S. Treasury, in February the United States took in roughly $120 billon from income taxes and spent just over $76 billion to service interest on the debt.
Thats right $76 billion in interest alone.
For context, we spent:
Social Security: $121 billion
Income Security: $90 billion
Health: $76 billion
Medicare: $73 billion
National Defense: $65 billion
You can download the complete Receipts and Outlays of the United States Government HERE
As we continue to borrow form future generations to sustain our current lifestyle, Gold and Bitcoin are starting to call our bluff.
Bitcoin & Gold At Record Highs
Bitcoiners and Gold Bugs have been tap dancing down Wall Street as a new bull market for the digital asset ecosystem and hard money begin the first leg of ascent.
Bitcoin took out it’s $69,000 high set on November 10, 2021 - closing above $70,000 for the first time in history.
Gold is finally breaking out over its $1,921/oz high set on September 6, 2011 - currently trading at $2,160/oz.
Historical price action in gold shows a similar pattern - parabolic moves met by years of long drawn out consolidation.
After gold rallied into a climactic blow off top - reaching a new record high of $875/oz on January 21, 1980 - price corrected and went dormant, building a 28 year cup base before breaking out over previous highs.
Currently, gold is following a similar pattern after building yet another cup base for over a decade - the measured move on this break out can take gold over $3,000/oz.
Price can be used as a leading indicator and price is telling us that reckless spending will continue regardless of the result of the 2024 election.
Inflation Runs Hot
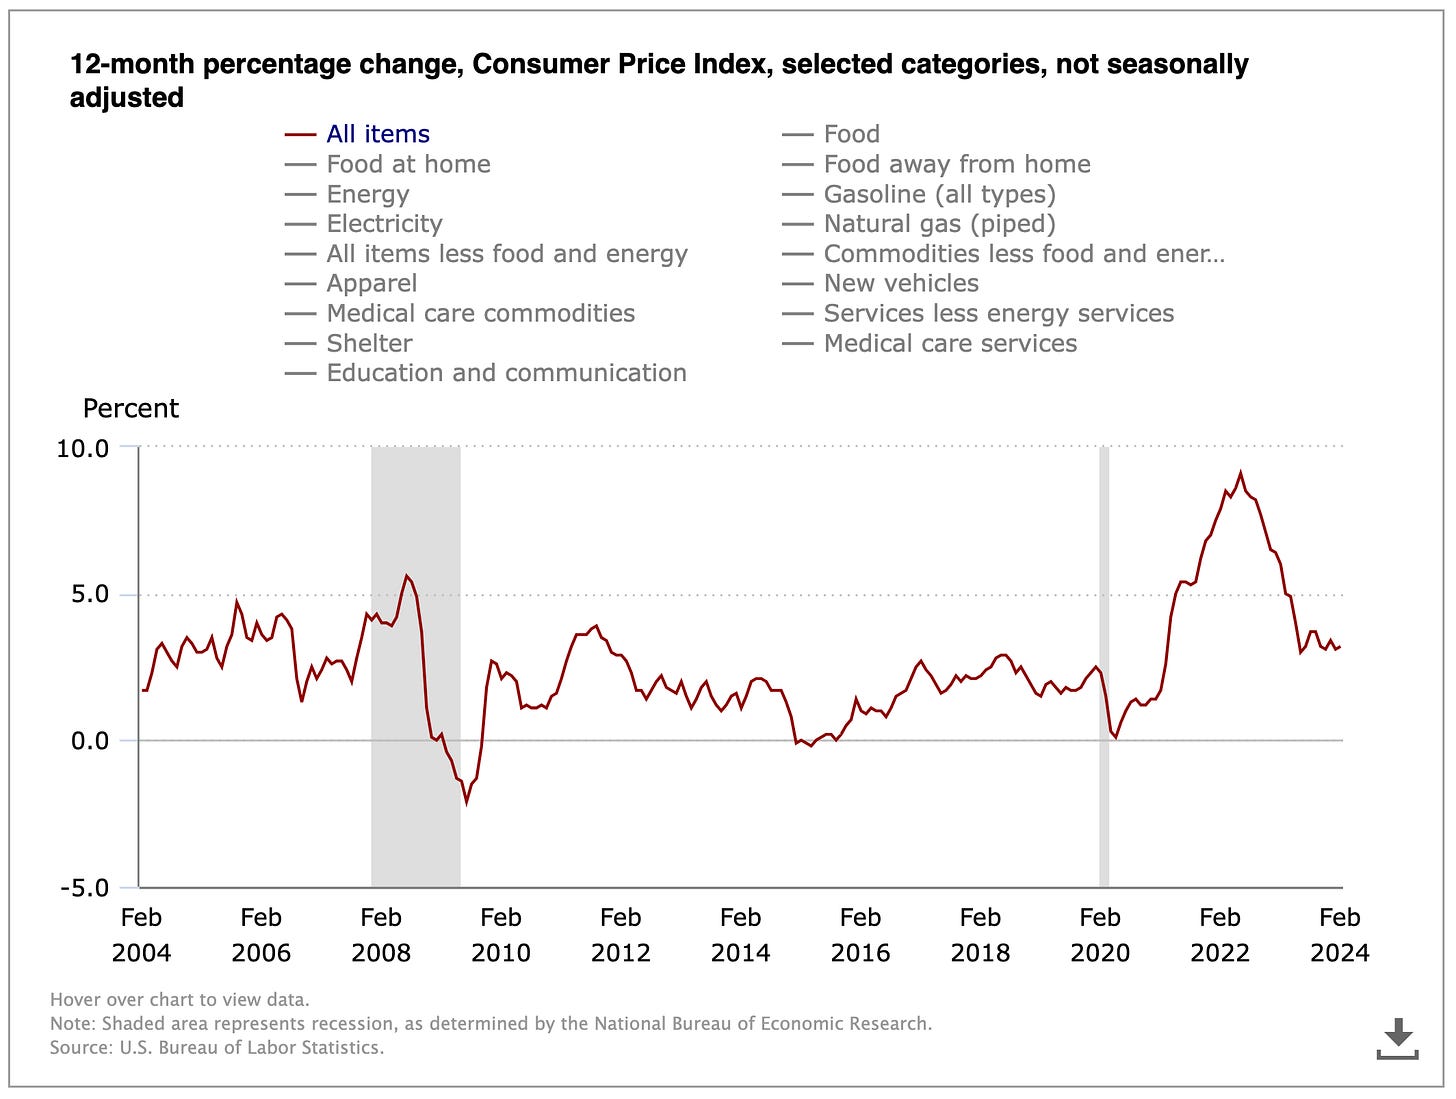
The Consumer Price Index released Tuesday showed headline CPI at 3.2% and Core CPI at 3.8% for February - both higher than expectations.
The fear is that inflation will remain steady above 3% - much higher than the Federal Reserves target of 2%.
After hitting a 9.1% peak in June 2022, inflation declined rapidly to a low of 3% in June 2023 - since then we have had sustained CPI prints north of 3%.
July 2023 3.2%
August 2023 3.7%
September 2023 3.5%
October 2023 3.2%
November 2023 3.1%
December 2023 3.4%
January 2024 3.1%
Note: Shelter and gasoline contributed to over 60% to the monthly increase in CPI
Perhaps another reason why precious metals and bitcoin are outperforming - the market is telling us we may have to deal with elevated levels of inflation for longer.
Additionally, this may put a damper on Wall Street’s expectations for a rate cut this summer.
Get Long Energy?
It’s no wonder why the latest CPI report showed such a large increase in gasoline - crude oil is on the move again.
After a harsh bear market - Light Crude Oil Futures are breaking back above its 200 day moving average - closing over $80.
Crude may spark a rally just in time for the heavy spring and summer travel months - leading to higher prices at the pump for many Americans.
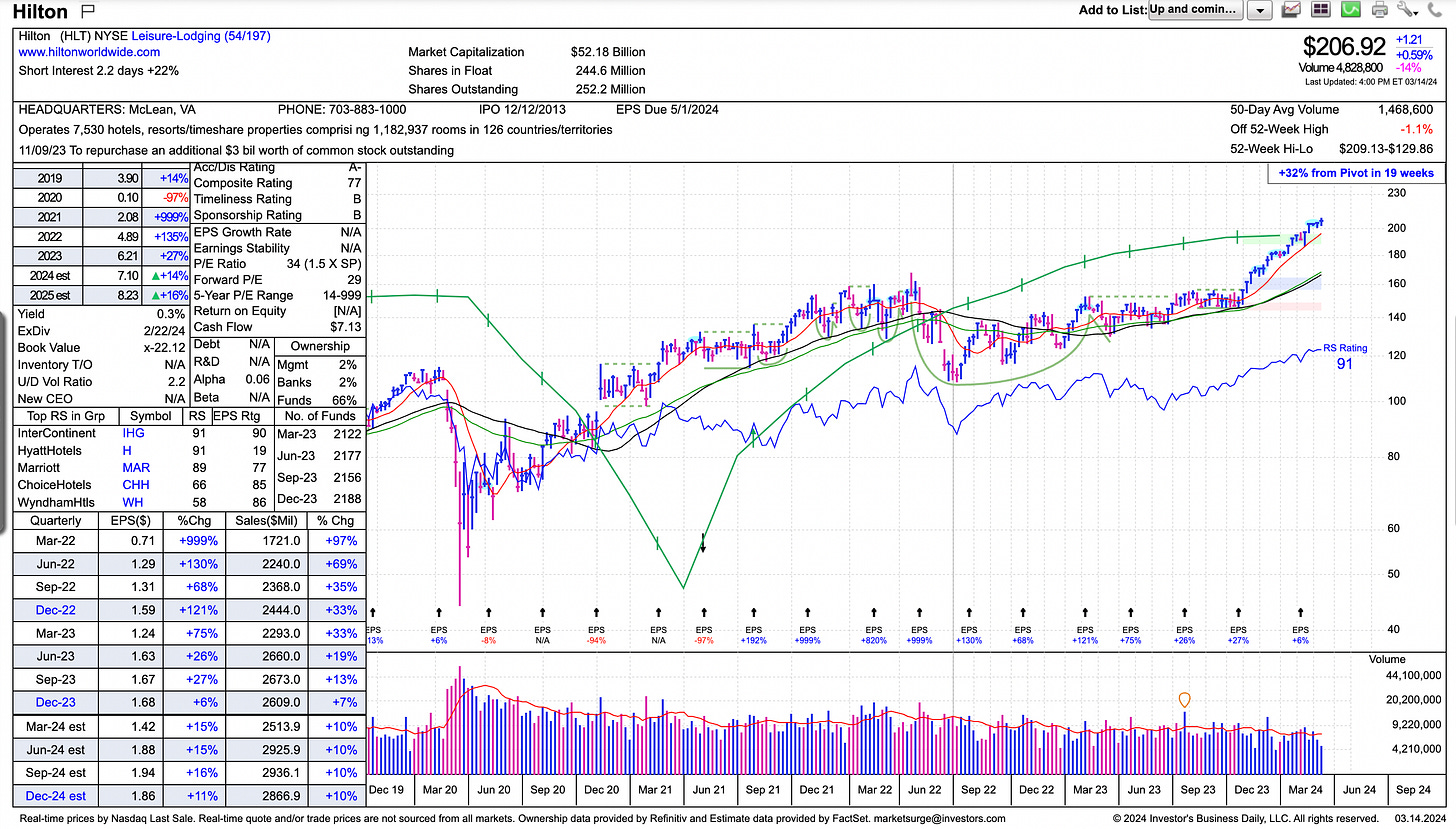
In last weeks issue of Behind The Street we covered the outperformance in Hotel & Hospitality Stocks - specifically HLT 0.00%↑ and H 0.00%↑.
Guidance remains strong and both companies expect a robust spring and summer travel season.
Demand will be high for travel and lodging this summer - supported by recent rally in crude.
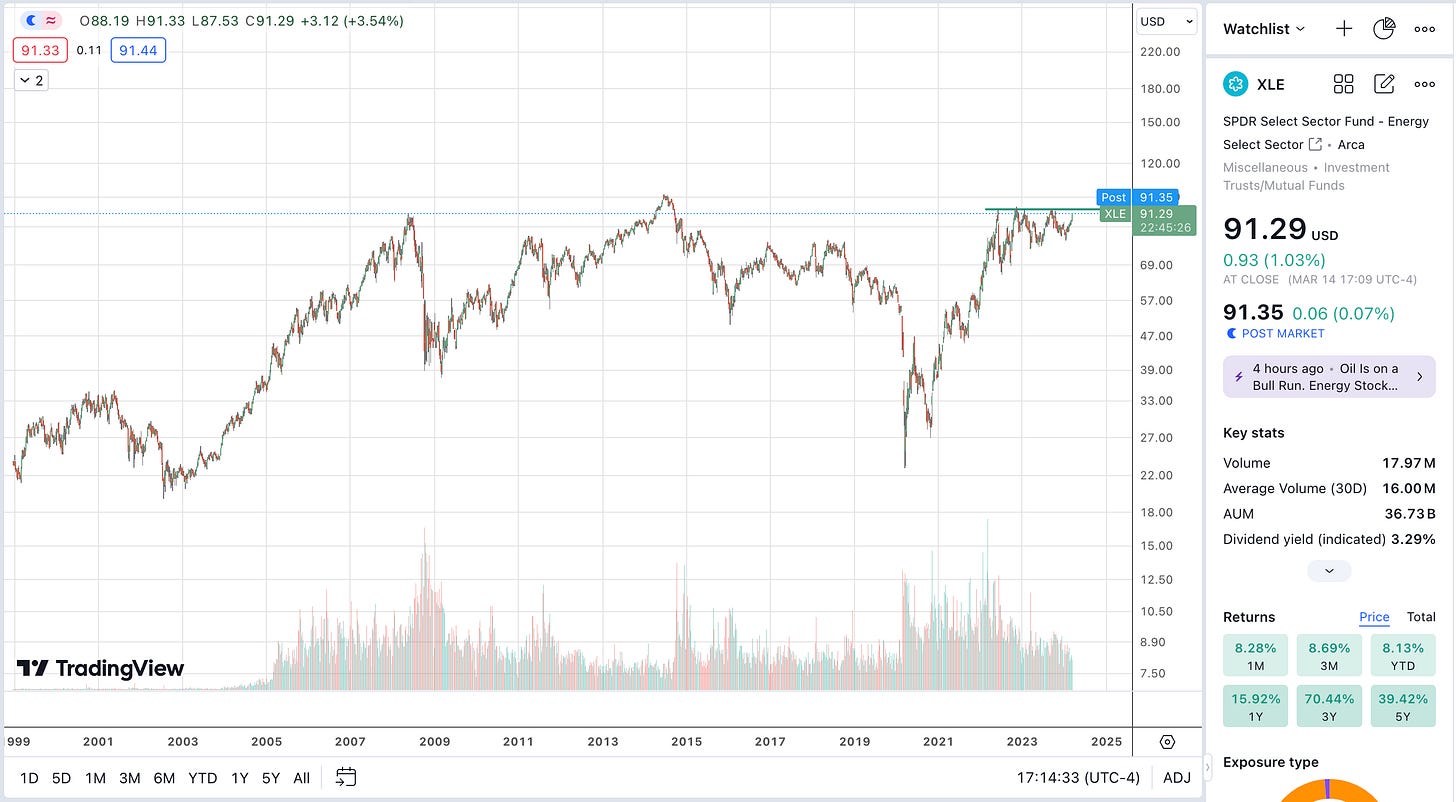
More confirmation can be seen in the SPDR Select Sector Energy Fund - XLE 0.00%↑after forming a nearly two year long handle.
A break out over $95 will send the energy sector running into new record highs - not great news for future inflation prints.
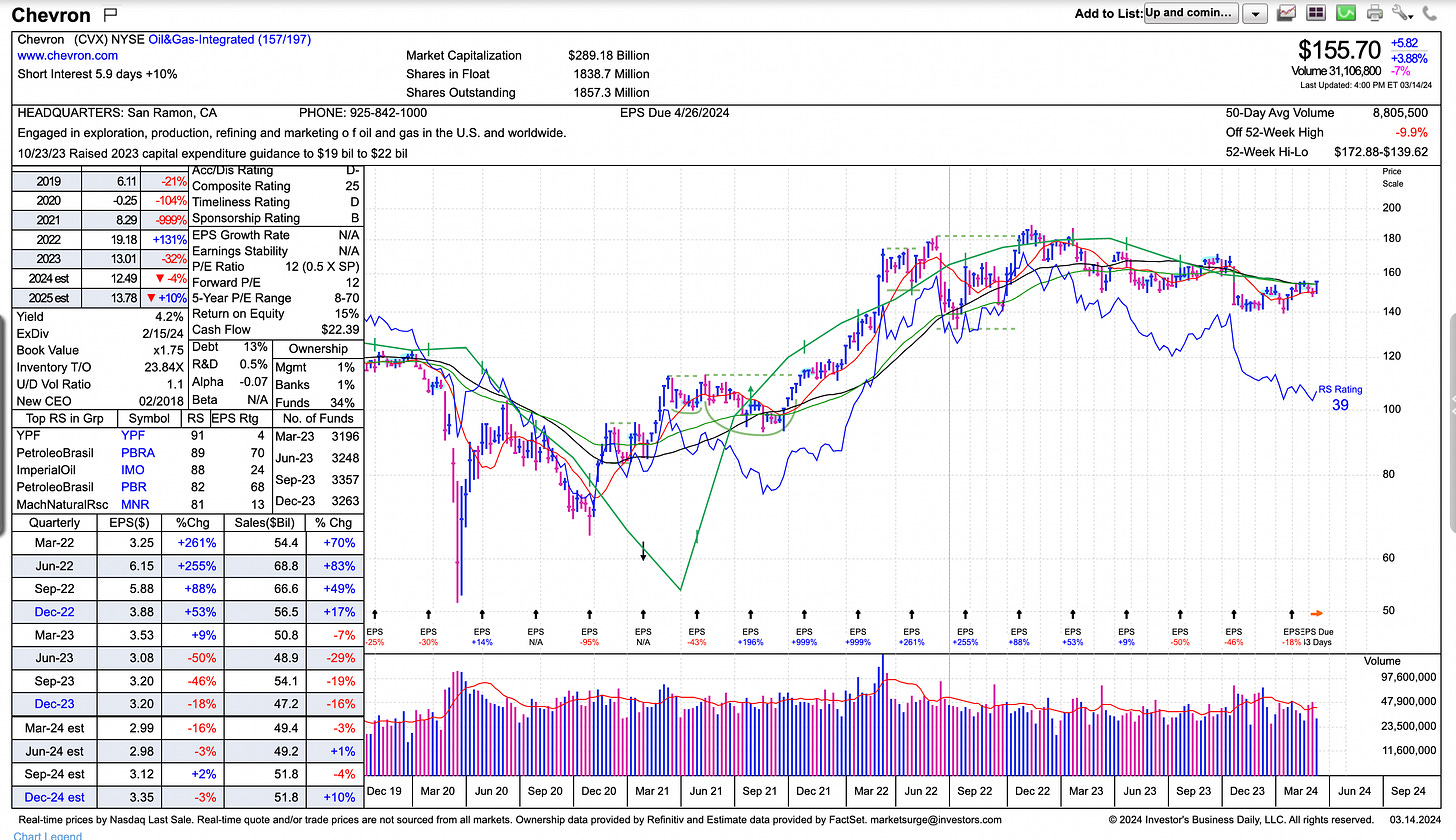
Oil & Gas giants Exxon Mobil XOM 0.00%↑ and Chevron CVX 0.00%↑ account for 40% of the entire ETF.
Should Exxon Mobil and Chevron test their previous highs, it will be a near certainty that the XLE 0.00%↑ will be trading well into new high territory.
Both stocks have regained their 200 day moving averages.
FOMC - Fed Chair Jerome Powell
March 19 - 20 the Federal Reserve will host its FOMC meeting and Fed Chair Jerome Powell will have an update regarding the course of monetary policy.
With a higher than expected inflation reading, record low unemployment, equity markets at record highs and crude oil on the rise - the chances of a rate cut next week are 0%.
Pictured above is the CME FedWatch Tool, it shows a 61% chance the Fed cuts rates at the June 12th meeting.
We believe the market is getting a little ahead of itself here as all economic data coming in suggests higher for longer - assuming the Fed isn’t forced to pivot.
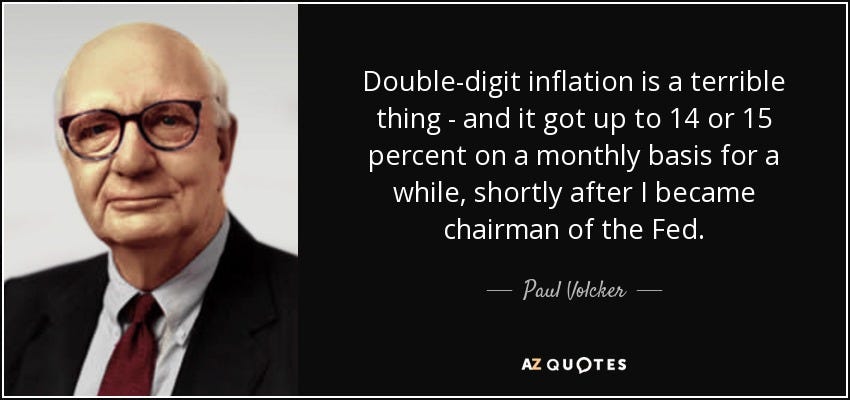
Jerome Powell is smart enough not to repeat the same mistakes of past Fed Presidents - cutting too quickly can lead to another tidal wave of inflation.
Paul Volcker became Fed Chair in August, 1979, and pushed the federal funds rate to over 20%
Major Indices Need To Cool?
Distribution days are starting to stack up on the S&P 500 and Nasdaq with 5 on each.
Many TMLs are extended after aggressive runs into new high territory, profit taking is normal in the first leg of a bull.
Be aware for shake outs to major moving averages such as the 50 day moving average.
The Nasdaq 100 was at one point up 10% from its break out into new highs without a back test of the 50.
Let the market take you out and use the 50 day moving average as your guard rail - it is important not to dislodge low cost core positions in TMLs unless there is violent break in market trend.
Lean bullish but stay cautious.
From the 2020 low, the Nasdaq 100 went on to pull back to the 50 day moving average 5 times before breaking below violently - ending the bull market.
Major contrarian indicators have been showing face including the below Barron’s cover.
The last time Barron’s had a cover story calling for the continuation of the bull run in the U.S. Dollar - the $DXY went on to collapse.
We are not saying the same thing will happen here, just be aware of the sentiment in the market.
During the first leg of a bull market, things can get far more extended than many market participants can expect.
Pictured above shows the 10 Day Moving Average New Highs & New Lows with New Highs aggressively outpacing new lows - classic action during the first leg of a new bull market.
This gap will close and the market will fall into correction, if the indexes are down 5%-7%, individual stocks may be down 15% - 20%.
Identify The Leaders & Laggards
If you want a nice garden you must constantly pull the weeds and water your flowers, its the same concept in the investment business.
Amongst Megacap tech stocks we have seen some decoupling.
The market continues to reward Microsoft MSFT 0.00%↑ as the stock traded into new highs while many leading stocks were negative.
Apple AAPL 0.00%↑ is now trading below its 200 day moving average with a 2025 EPS estimates revised down to $7.13.
Apple has a 5.81% weighting in the S&P 500, lackluster price action is a drag on the index.
Alphabet GOOGL 0.00%↑ has had textbook bull market price action, selling off to its 200 day moving average and met with heavy buy side volume as it forms a handle.
Alphabet has come under fire due to Google’s ‘Woke’ chatbot gemini - currently the market is telling us they will fix the issue.
Earnings look strong for the company all the way out to 2025.
Tesla TSLA 0.00%↑ has to be the biggest laggard out of the Megacap tech stocks, breaking down violently and living below the 200 day
You will notice a series of lower highs and lower lows - extremely oversold, you can expect a relief rally soon.
We would not touch the stock unless it can make its way above $299.
Wall Street has not been happy with Elon Musk and team for slashing prices on their EVs and causing significant margin compression.
We expect margin expansion again soon - more on Tesla in our next issue.
Should the market fall into correction, pay close attention to the stocks making new highs and selling down less. These are quality names with institutional sponsorship.
New York City Real Estate - Featured Listing
One57 157 W 57th Street New York, NY 10019 - the first building ever constructed on New York’s Billionaires Row.
Check out the last available sponsor unit in the building.
1 Bed 1.5 Bath
1,021 SF Interior
393 SF Private Terrace
5 Star Hotel Park Hyatt In Building
Bathrooms are custom designed by Thomas Juul Hansen
Swimming Pool
Thank You
A big THANK YOU to all of our clients! Without your support we wouldn’t have been able to secure #1 Medium Team - Transactions.
Updates
The Behind The Street Newsletter will be published every other Thursday.
The Behind The Street Newsletter is for educational use only, not financial advice.
The newsletter will have a focus on financial markets, equities, fixed income, real estate and a market update section focusing on New York City & Miami real estate.
I have joined the Kirsten Jordan Team at Douglas Elliman About Me Click Here
If yourself, a family member or friend is looking to buy, sell or rent anywhere in New York or Miami please contact me: Thomas.Malloy@elliman.com
We also work with institutional clients looking for exposure to NYC and Miami.













I appreciate you putting the information in easy to understand terms
First time read, great stuff.